Category:Temporal population graphs of Magdeburg
Jump to navigation
Jump to search
Media in category "Temporal population graphs of Magdeburg"
The following 9 files are in this category, out of 9 total.
-
 Einwohnerentwicklung von Magdeburg - ab 1871.svg 800 × 400; 109 KB
-
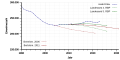 Einwohnerentwicklung von Magdeburg - Prognosen.svg 800 × 400; 88 KB
-
 Einwohnerentwicklung von Magdeburg ab 1990.svg 800 × 400; 33 KB
-
 Einwohnerentwicklung von Magdeburg von 1400 bis 1870.svg 800 × 400; 45 KB
-
 Einwohnerentwicklung von Magdeburg von 1871 bis 1944.svg 800 × 400; 40 KB
-
 Einwohnerentwicklung von Magdeburg von 1945 bis 1989.svg 800 × 400; 32 KB
-
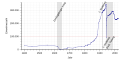 Einwohnerentwicklung von Magdeburg.svg 800 × 400; 122 KB
-
 Population Statistics Magdeburg.png 910 × 562; 69 KB
-
 Voraussichtliche demografische Entwicklung Magdeburgs.jpg 915 × 571; 41 KB


