Category:Temporal population graphs of Iran
Jump to navigation
Jump to search
Media in category "Temporal population graphs of Iran"
The following 24 files are in this category, out of 24 total.
-
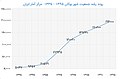 BukanPopulation Change (fa).jpg 700 × 462; 150 KB
-
 Diagram of Propulation of Iran.jpg 647 × 463; 40 KB
-
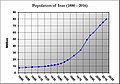
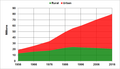
 Iran Population (1880-2005).JPG 681 × 485; 41 KB
-
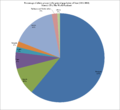
 Percentage of ethnic groups in the general population of Iran (1990-1993).png 2,601 × 2,387; 241 KB
-
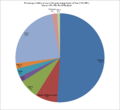 Percentage of ethnic groups in the general population of Iran (1994-2011).png 2,601 × 2,387; 248 KB
-
 Percentage of ethnic groups in the general population of Iran (2012-2014).png 2,601 × 2,387; 234 KB
-
 Iran demography.svg 750 × 450; 10 KB
-
 Iran Population (1880-2005)-Hebrew.jpg 681 × 485; 89 KB
-
 Iran Population (1880-2016).jpg 687 × 483; 91 KB
-
 Iran Population 1260-1395.jpg 700 × 482; 49 KB
-
 Iran Population 1880-2005.JPG 692 × 504; 43 KB
-
 Iran Population Change 1956-2006.JPG 673 × 476; 29 KB
-
 Iran Population-Urban vs Rural-Persian.png 897 × 478; 21 KB
-
 Iran Population-Urban vs Rural.png 899 × 516; 23 KB
-
 Iran population.svg 800 × 600; 86 KB
-
 Iran-demography.png 725 × 426; 8 KB
-
 Irán 2.png 957 × 513; 111 KB
-
 Net Migration Iran.png 738 × 348; 3 KB
-
 Percentage of ethnic groups in the general population of Iran (1982-1989).png 2,601 × 2,387; 223 KB
-
 Einwohner Teheran.png 3,386 × 2,128; 26 KB
-
 Tehran Population (1956-2006).JPG 651 × 490; 41 KB
-
 Tehran Population (1956-2006).png 724 × 550; 51 KB
-
 Tehran Population (1956-2016).png 665 × 494; 20 KB
-
 Tehran Population 1956-2006.JPG 656 × 493; 34 KB
.jpg)

.JPG)
.png)
.png)
.png)

-Hebrew.jpg)
.jpg)


.png)

.JPG)
.png)
.png)
