Category:Temporal population graphs of Hannover
Jump to navigation
Jump to search
Media in category "Temporal population graphs of Hannover"
The following 23 files are in this category, out of 23 total.
-
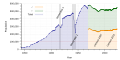 Einwohnerentwicklung Hannover ab 1871 Geschlechter.svg 800 × 400; 153 KB
-
 Einwohnerentwicklung von Ahlem-Badenstedt-Davenstedt (Hannover).svg 800 × 400; 44 KB
-
 Einwohnerentwicklung von Bothfeld-Vahrenheide (Hannover).svg 800 × 400; 44 KB
-
 Einwohnerentwicklung von Buchholz-Kleefeld (Hannover).svg 800 × 400; 51 KB
-
 Einwohnerentwicklung von Döhren-Wülfel (Hannover).svg 800 × 400; 40 KB
-
 Einwohnerentwicklung von Hannover (log10).svg 800 × 400; 88 KB
-
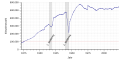 Einwohnerentwicklung von Hannover - ab 1871.svg 800 × 400; 77 KB
-
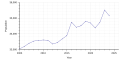
 Einwohnerentwicklung von Hannover - Prognose 2006–2025.svg 800 × 400; 24 KB
-
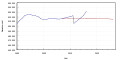
 Einwohnerentwicklung von Hannover mit Prognosen.svg 800 × 400; 47 KB
-
 Einwohnerentwicklung von Hannover.svg 800 × 400; 91 KB
-
 Einwohnerentwicklung von Herrenhausen-Stöcken (Hannover).svg 800 × 400; 44 KB
-
 Einwohnerentwicklung von Kirchrode-Bemerode-Wülferode (Hannover).svg 800 × 400; 55 KB
-
 Einwohnerentwicklung von Linden-Limmer (Hannover).svg 800 × 400; 40 KB
-
 Einwohnerentwicklung von Misburg-Anderten (Hannover).svg 800 × 400; 47 KB
-
 Einwohnerentwicklung von Mitte (district of Hannover).svg 800 × 400; 55 KB
-
 Einwohnerentwicklung von Nord (Hannover).svg 800 × 400; 47 KB
-
 Einwohnerentwicklung von Ricklingen (district of Hannover).svg 800 × 400; 44 KB
-
 Einwohnerentwicklung von Südstadt-Bult (Hannover).svg 800 × 400; 44 KB
-
 Einwohnerentwicklung von Vahrenwald-List (Hannover).svg 800 × 400; 45 KB
-
 Population Statistics Hannover.png 910 × 562; 63 KB
-
 Hannover population.svg 800 × 400; 31 KB
-
 Population development of Hannover Germany - Multilingual.svg 800 × 400; 102 KB
-


.svg)
.svg)
.svg)
.svg)
.svg)


.svg)
.svg)
.svg)
.svg)
.svg)
.svg)
.svg)
.svg)
.svg)


