Category:Temporal population graphs of Cottbus
Jump to navigation
Jump to search
Media in category "Temporal population graphs of Cottbus"
The following 14 files are in this category, out of 14 total.
-
 Altersstrukturentwicklung Cottbus.pdf 1,752 × 1,239; 96 KB
-
 Bevölkerungsentwicklung Cottbus.pdf 1,752 × 1,239; 121 KB
-
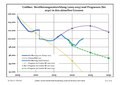 Bevölkerungsprognosen Cottbus.pdf 1,752 × 1,239; 68 KB
-
 Cb statistik.png 3,305 × 1,880; 389 KB
-
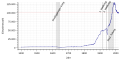
 Einwohnerentwicklung von Cottbus (log10).svg 800 × 400; 69 KB
-
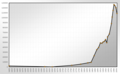
 Einwohnerentwicklung von Cottbus - ab 1871.svg 800 × 400; 65 KB
-
 Einwohnerentwicklung von Cottbus - Prognosen.svg 800 × 400; 45 KB
-
 Einwohnerentwicklung von Cottbus.jpg 2,480 × 1,984; 306 KB
-
 Einwohnerentwicklung von Cottbus.svg 800 × 400; 74 KB
-
 EWStatistikCB2009.PNG 1,647 × 649; 48 KB
-
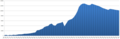
 Population development of Cottbus 1400-2013.svg 1,938 × 906; 106 KB
-
 Population Statistics Cottbus.png 910 × 562; 64 KB
-
 PopulationCB2008.PNG 1,596 × 522; 56 KB
-
 Statistik cottbus.gif 683 × 358; 6 KB

.svg)


