Category:Temperature and rainfall charts
Jump to navigation
Jump to search
Media in category "Temperature and rainfall charts"
The following 26 files are in this category, out of 26 total.
-
 Annual rainfall in Premodern Seoul.svg 496 × 283; 123 KB
-

-
 Average temperatures in Philadelphia.png 648 × 123; 34 KB
-
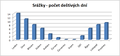 Dešťové srážky - Kréta.png 602 × 281; 15 KB
-
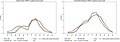 Figure 6 from Dyer et al 2019.jpg 2,128 × 742; 190 KB
-

-
 Gráfico da chuva fonte projeteee.png 561 × 444; 34 KB
-
 La température de chlef.jpg 720 × 960; 69 KB
-
 Mapa de las lluuvias acidas.jpg 800 × 550; 144 KB
-
 Meterological Observations recorded at 8 30Hrs IST of July 2 2019.jpg 1,358 × 688; 107 KB
-
 Midden-nl-1706-nu-3-11-30jaar.png 1,300 × 730; 366 KB
-
 MjerenjaPozega20210625-zapad.png 876 × 570; 38 KB
-
 Neerslag in Paramaribo.png 605 × 340; 19 KB
-
 Pluie thiaroye.png 1,791 × 810; 77 KB
-
 Precipitation Averages.png 652 × 115; 32 KB
-
 Precipitazioni in Italia dal 1901 al 2020.png 711 × 497; 108 KB
-
 Rainfall in Mexico (IA rainfallinmexico00escorich).pdf 770 × 1,177, 92 pages; 3 MB
-
 Relationship between latitude vs. temperature and precipitation.png 579 × 404; 44 KB
-
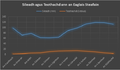 Sileadh agus teaothachd ann an Eaglais Steafain.png 571 × 335; 28 KB
-
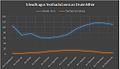 Sileadh agus Teothachd anns an Druim Mhor.jpg 574 × 330; 35 KB
-
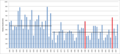
 TNn, Istanbul.png 800 × 600; 78 KB
-
 Tuskegee Institute Meteorological Record for June 1922, by George Washington Carver.pdf 1,708 × 1,310; 20.79 MB
-
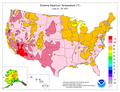 US Extreme Temperature June 20 to 26, 2021.png 4,400 × 3,400; 376 KB
-
 USCRN Average Temperature Anomaly for Contiguous United States.svg 624 × 281; 141 KB
-
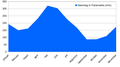
 Weather data of the town Le Tampon.png 457 × 345; 65 KB
-
 Western Canada Extreme Temperatures June 20 to 26, 2021.png 2,550 × 1,650; 117 KB

_(19177346200).jpg)

.jpg)


