Category:Temperature-entropy diagrams
Jump to navigation
Jump to search
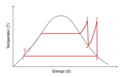
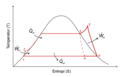
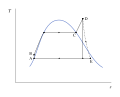
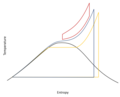
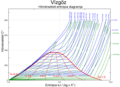
English: Temperature-entropy diagrams, T-s, T-S, or Stodola diagrams, relate the temperature of a system to its entropy, usually as it follows a thermodynamic cycle.
thermodynamic diagram used in thermodynamics to visualize changes to temperature and specific entropy during a thermodynamic process or cycle as the graph of a curve | |||||
| Upload media | |||||
| Subclass of | |||||
|---|---|---|---|---|---|
| |||||
Media in category "Temperature-entropy diagrams"
The following 105 files are in this category, out of 105 total.
-
 Adiabate Maschinen.jpg 958 × 458; 51 KB
-
 Allgemeiner Kreisprozess.jpg 638 × 488; 85 KB
-
 Basic-cycles.JPG 515 × 417; 22 KB
-
 Brayton cycle.svg 745 × 293; 56 KB
-
 Carnot-proces.png 794 × 1,123; 35 KB
-
 Ciclu Carnot cu T2 zero..png 617 × 556; 7 KB
-
 CR-Prozess T-s-Diagramm.svg 400 × 307; 13 KB
-
 DamierTS.svg 612 × 764; 82 KB
-
 Dampfkessel im TS-Diagramm.png 2,000 × 1,490; 65 KB
-
 Diagrama T-s.JPG 546 × 567; 14 KB
-
 Diagrama Temperatura x Entropia.png 734 × 638; 9 KB
-
 Diagramme TS du cycle Rankine (fr).png 929 × 598; 20 KB
-
 Diagrammes T-s comportements de base.svg 1,895 × 870; 12 KB
-
 Dieselprozess im T-s-Diagramm.jpg 520 × 574; 58 KB
-
 Dry fluid.png 658 × 444; 10 KB
-
 Ejemplo Diagrama T-S.png 1,300 × 975; 53 KB
-
 Entropie1.gif 616 × 508; 5 KB
-
 Ergänzungen im TS-Diagramm.png 611 × 653; 131 KB
-
 Exergie der Wärme.jpg 930 × 839; 130 KB
-
 Exergie der Wärme.svg 600 × 520; 2 KB
-
 Heat shield in T-S chart.png 856 × 654; 235 KB
-
 Iapws-Ts-diagram.png 884 × 730; 7 KB
-
 Isentropic fluid.png 668 × 443; 10 KB
-
 Isentropic.jpg 500 × 500; 11 KB
-
 Joule-T-s-diagram.jpg 800 × 703; 157 KB
-
 Kaltdampfprozess T-s-Diagramm.svg 400 × 287; 11 KB
-
 Lenoir Ts.svg 400 × 380; 21 KB
-
 Meziprihrivani.png 1,929 × 1,026; 51 KB
-
 Nh3 Ts en.png 976 × 599; 23 KB
-
 Nh3 Ts hu.png 976 × 599; 23 KB
-
 Novel classification of pure working fluids.svg 1,833 × 904; 426 KB
-
 OttoCycle.png 380 × 290; 14 KB
-
 OttoCycleTSDiagram.svg 709 × 709; 17 KB
-
 P-v T-s diagrams of arbitrary evolutions.svg 2,472 × 1,225; 14 KB
-
 Rankine cycle reheat TS sv.png 929 × 598; 49 KB
-
 Rankine cycle superheat TS sv.png 929 × 598; 58 KB
-
 Rankine cycle Ts.png 929 × 598; 30 KB
-
 Rankine cycle with reheat small.jpg 272 × 293; 12 KB
-
 Rankine cycle with reheat.jpg 400 × 450; 38 KB
-
 Rankine cycle with superheat.jpg 544 × 604; 65 KB
-
 Rankine-regen.png 2,168 × 2,264; 244 KB
-
 Rankine-reheat.png 2,168 × 2,264; 243 KB
-
 Rankine-superheat.png 2,168 × 2,264; 222 KB
-
 Rankineov ciklus međupregrijač.JPG 408 × 465; 24 KB
-
 Rankineov ciklus regenerativni.JPG 409 × 464; 25 KB
-
 Rankineov ciklus Ts.PNG 929 × 598; 32 KB
-
 Regenerative Rankine Cycle Mixing1 T-sChart.svg 638 × 496; 90 KB
-
 Regenerative Rankine Cycle Mixing3 T-sChart.svg 638 × 496; 144 KB
-
 Regenerative Rankine Cycle Surface3 T-sChart.svg 638 × 496; 147 KB
-
 Regenerative Rankine Cycle Surface3 T-sChart2.svg 638 × 496; 149 KB
-
 Regenerative Rankine Cycle Surface3 T-sChart3.svg 638 × 496; 147 KB
-
 Regenerative Rankine Cycle T-s Chart.svg 638 × 496; 77 KB
-
 Regenerative Rankine Cycle TsChart.svg 638 × 496; 74 KB
-
 Regenerative rankine cycle.jpg 409 × 464; 24 KB
-
 Reheated Rankine Cycle T-s Chart.svg 638 × 496; 76 KB
-
 Reheated Rankine Cycle TsChart.svg 638 × 496; 76 KB
-
 Reheated-Regenerative Rankine Cycle T-s Chart.svg 638 × 496; 94 KB
-
 Reheated-Regenerative Rankine Cycle TsChart.svg 638 × 496; 94 KB
-
 SER-ZDEH09.03.26 1Ejpg(pV Ts Tab VergleicheNSC,D,SC nur kvalitativ.JPG 1,094 × 485; 105 KB
-
 T-s and p-v diagrams for Otto and Diesel cycles.svg 3,215 × 3,884; 45 KB
-
 T-s Chart Lorenz2.svg 638 × 496; 33 KB
-
 T-s diagram Carnot cycle.svg 1,223 × 1,225; 12 KB
-
 T-s diagram for a conductive heat exchange.svg 1,267 × 1,225; 15 KB
-
 T-s diagram for a liquid-vapor.svg 1,296 × 1,027; 9 KB
-
 T-s diagram isobaric isochoric perfect gas.svg 1,223 × 1,225; 13 KB
-
 T-S diagram of inverted Brayton cycle.png 506 × 413; 31 KB
-
 T-s diagram reversible vs irreversible evolution.svg 1,224 × 1,225; 13 KB
-
 T-s diagram specific heat.svg 1,223 × 1,404; 14 KB
-
 T-S diagram.png 1,416 × 672; 20 KB
-
 T-s diagram.svg 2,030 × 1,427; 784 KB
-
 T-s diagrams compression expansion.svg 2,648 × 1,225; 15 KB
-
 T-s diagrams elementary evolutions.svg 2,429 × 1,225; 12 KB
-
 T-S Diesel Cycle.svg 744 × 1,052; 8 KB
-
 T-s dijagram radni fluidi.png 349 × 176; 25 KB
-
 T-s process diagramm.jpg 400 × 400; 8 KB
-
 T-s-diagram-steam.png 977 × 632; 127 KB
-
 T-s-diagramm-dampf.png 977 × 632; 117 KB
-
 T-s-Diagramm.jpg 920 × 377; 84 KB
-
 Temperature-entropy charg of a turbofan with afterburner.svg 639 × 514; 23 KB
-
 Temperature-entropy chart for steam, imperial units.svg 1,302 × 1,325; 150 KB
-
 Temperature-entropy chart of a basic Rankine cycle.svg 1,396 × 1,127; 28 KB
-
 Temperature-entropy chart of a Carnot cycle operating with steam.svg 1,396 × 1,127; 20 KB
-
 Temperature-entropy chart of a gas generator.svg 516 × 487; 19 KB
-
 Temperature-entropy chart of a pure turbojet.svg 516 × 487; 21 KB
-
 Temperature-entropy chart of a Rankine cycle with turbine bleed 01.svg 1,396 × 1,127; 23 KB
-
 Temperature-entropy chart of a regenerative Rankine cycle.svg 1,396 × 1,127; 24 KB
-
 Temperature-entropy chart of a superheated Rankine cycle.svg 1,396 × 1,127; 21 KB
-
 Temperature-entropy chart of a superheated, reheated Rankine cycle.svg 1,396 × 1,127; 23 KB
-
 Temperature-entropy chart of a turboprop or turboshaft engine.svg 516 × 487; 18 KB
-

-
 Temperature-entropy chart of a turboshaft with turbine cooling.svg 516 × 487; 22 KB
-
 Temperature-entropy chart of a twin-spool turboshaft.svg 516 × 487; 23 KB
-
 Traditional classification of pure working fluids.svg 1,553 × 391; 179 KB
-
 Ts diagrams of sub trans super cycles.png 770 × 623; 34 KB
-
 Ts-Humphrey cycle.png 553 × 426; 12 KB
-
 TS-Wasserdampf 100.png 792 × 612; 17 KB
-
 TS-Wasserdampf engl.png 1,682 × 1,187; 67 KB
-
 TS-Wasserdampf hu.png 1,397 × 1,013; 64 KB
-
 TS-Wasserdampf. neu.png 1,682 × 1,188; 66 KB
-
 TSdiagram.gif 621 × 417; 9 KB
-
 TsDiagramm-Seiliger.png 1,201 × 900; 13 KB
-
 Verdampfung.jpg 1,407 × 1,068; 438 KB
-
 Wet fluid.png 620 × 447; 9 KB
-
 WP-T-s-Dia.jpg 857 × 729; 64 KB
-
 Да арт. - трэці закон тэрмадынамікі.jpg 692 × 498; 68 KB


.png)


