Category:Tax charts
Jump to navigation
Jump to search
Subcategories
This category has the following 4 subcategories, out of 4 total.
Media in category "Tax charts"
The following 108 files are in this category, out of 108 total.
-
 (2023) OECD average tax wedge as percentage of labour cost.svg 1,169 × 724; 685 KB
-
 Accijnzen.jpg 720 × 504; 34 KB
-
 Accijnzen2.jpg 720 × 504; 60 KB
-
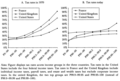
 Aktiengesellschaft 100K.jpg 792 × 446; 46 KB
-
 Aktiengesellschaft 2000K.jpg 792 × 446; 43 KB
-
 Aliq efet IRPF09.png 576 × 362; 6 KB
-

-

-
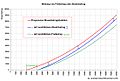
 Arten der Steuerprogression.jpg 556 × 575; 165 KB
-
 Automated Payment Tax Pie Chart.jpg 500 × 300; 30 KB
-
 Average Effective Property tax of the 50 States (2007).jpg 671 × 478; 69 KB
-
 Average Effective Sales Tax of the 50 States (2007).gif 564 × 443; 63 KB
-
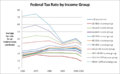
 Average US Federal Tax Rates by Income Group, 1979 to 2010.png 600 × 403; 53 KB
-

-
 CAP2010.png 821 × 501; 56 KB
-
 Changes Top 1% Share and Top Marginal Tax Rate v2.jpg 915 × 794; 108 KB
-
 China tax 2011.png 704 × 357; 14 KB
-
 Cjcnit.svg 232 × 150; 2 KB
-
 Coin fiscal OCDE.png 1,166 × 673; 51 KB
-
 Composition of tax revenues, OWID.svg 850 × 600; 7 KB
-
 Congressional Budget Office report 2019-01-24 - Marginal Federal Tax Rates on Labor Income - 1962 to 2028.pdf 1,650 × 1,275, 47 pages; 1.43 MB
-
 Corporate Income Tax as a Share of GDP, 1946 - 2009.png 913 × 663; 21 KB
-
 Cotisations sociales OCDE.png 1,068 × 689; 31 KB
-
 Crs eitc 2020.png 649 × 393; 90 KB
-
 Deferred Corporate Foreign Earnings 2001-2010.jpg 1,050 × 787; 85 KB
-
 Diffdiesbenz.jpg 720 × 504; 100 KB
-

-
 Effective Corporate Tax Rates (2009).jpg 528 × 377; 71 KB
-
 Effective Federal Excise Tax Rate by Income Group (2007).jpg 558 × 432; 66 KB
-

-
 Effective tax rates, US high-income.png 743 × 710; 218 KB
-

-
 Einkommensteuer A 2009.jpg 939 × 585; 187 KB
-
 Einkommensteuer D Splitting 2010.jpg 1,180 × 744; 500 KB
-
 Einkommensteuer in den Vereinigten Staaten.png 961 × 594; 17 KB
-
 ESt-Steuersatz-GB.png 800 × 514; 47 KB
-
 EstBetragsfunktionD2008.svg 500 × 300; 5 KB
-
 Estimated Effect of Carbon Tax in US.png 1,322 × 888; 30 KB
-
 Euro95-2009-cbs.jpg 812 × 478; 145 KB
-

-
 Excise Taxes Share of Federal Revenue 1950 - 2007.jpg 585 × 438; 49 KB
-
 Excise taxes.jpg 2,855 × 1,880; 716 KB
-
 Exit tax.jpg 688 × 1,306; 178 KB
-
 Extragrundavdrag.svg 1,053 × 744; 12 KB
-
 Federal excise taxes on fuel.webp 1,061 × 415; 43 KB
-
 Federal Income Tax Rates in the US, 2009.jpg 665 × 430; 46 KB
-
 Federal Receipts by Source, 2010.jpg 458 × 471; 59 KB
-
 Federal Sales Taxes.png 1,024 × 768; 168 KB
-
 Federal tax rate by income group.png 1,071 × 657; 63 KB
-
 Federal taxes by type.pdf 2,760 × 689; 593 KB
-
 Federal, State, and Local income tax GDP.pdf 2,679 × 683; 319 KB
-
 Fiscal policy.png 903 × 759; 16 KB
-
 Freibetrag Absetzbetrag.jpg 1,102 × 740; 230 KB
-
 Fuel taxes in the united states.png 4,816 × 2,817; 2.72 MB
-
 Gasoline Diesel Taxes.webp 4,962 × 2,934; 574 KB
-
 GDP per capita PPP vs CIT 2016.svg 1,513 × 850; 66 KB
-
 GDP per capita PPP vs direct taxes 2016.svg 1,513 × 850; 66 KB
-
 GDP per capita PPP vs excises 2016.svg 1,513 × 850; 70 KB
-
 GDP per capita PPP vs import taxes 2016.svg 1,513 × 850; 65 KB
-
 GDP per capita PPP vs indirect taxes 2016.svg 1,513 × 850; 68 KB
-
 GDP per capita PPP vs PIT 2016.svg 1,513 × 850; 62 KB
-
 GDP per capita PPP vs property taxes 2016.svg 1,513 × 850; 63 KB
-
 GDP per capita PPP vs social contributions 2016.svg 1,513 × 850; 68 KB
-
 GDP per capita PPP vs taxes 2016.svg 1,513 × 850; 72 KB
-
 GDP per capita PPP vs VAT 2016.svg 1,513 × 850; 65 KB
-
 German tax rate on corporate income 1995-2009.png 2,080 × 1,347; 28 KB
-

-
 Graf dds.png 630 × 445; 33 KB
-
 Grafica de Recaudacion.jpg 842 × 532; 68 KB
-
 Growth of Real Disposable Household Income by Decile, OWID.svg 850 × 600; 13 KB
-
 Historical Marginal Tax Rate for Highest and Lowest Income Earners.jpg 4,458 × 1,973; 1.3 MB
-
 Historie Steuersätze ESt USt D.png 1,125 × 693; 59 KB
-
 ImpotNegatif.png 529 × 472; 7 KB
-
 ImpotProgReg.png 515 × 503; 9 KB
-
 Impuesto monopolio.JPG 962 × 535; 49 KB
-
 Impuesto monopolio.svg 538 × 335; 27 KB
-
 Income inequality, OWID.svg 850 × 600; 6 KB
-

-

-
 Jobbskatteavdrag.svg 1,052 × 744; 61 KB
-
 Lewisville, Texas Adjusted Property Tax Rates 1964-1980.svg 810 × 285; 31 KB
-
 Lewisville, Texas Property Tax Rates 1982-2012.svg 810 × 285; 42 KB
-
 Lowertax.svg 1,053 × 744; 58 KB
-
 Median and mean household disposable income, OWID.svg 850 × 600; 7 KB
-
 Model spotřební daně.png 944 × 650; 72 KB
-
 Momskalkylator.jpg 301 × 182; 26 KB
-

-
 OECD Social Security Contributions.svg 1,440 × 720; 102 KB
-
 Patents by type of activity in Russia.jpg 660 × 312; 71 KB
-
 Patents in the regions of Russia.jpg 660 × 671; 131 KB
-
-
 State and Local Income Tax in the United States.png 1,086 × 1,020; 81 KB
-
 Tax rate in Spain for one person.png 894 × 562; 102 KB
-
 Tax rates on dividend income in OECD.svg 1,440 × 720; 127 KB
-
 Tax revenue as a percentage of GDP (1985-2014).png 1,081 × 679; 111 KB
-
 TopTaxIncidence PikettySaez2007.png 1,524 × 1,028; 497 KB
-
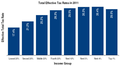
 Total Effective Tax Rates 2011.jpg 655 × 440; 131 KB
-
 U.S. Federal Income Tax Rates 2013.png 960 × 720; 54 KB
-
 U.S. Federal Income Tax Rates.png 1,724 × 1,149; 101 KB
-
 US effective corp tax rate 1947-2012.png 917 × 667; 67 KB
-
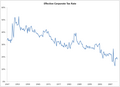
 US Effective Corporate Tax Rate 1947-2011 v2.jpg 764 × 452; 67 KB
-
 US effective tax rates.png 703 × 387; 67 KB
-

-
 US Federal Income and Payroll Tax Rates.png 1,024 × 730; 86 KB
-
 US high-income effective tax rates.png 744 × 549; 46 KB
-
 US tax incidence 2007.png 936 × 520; 44 KB
-

-
 USCorporateTaxRates.png 1,138 × 436; 37 KB
_OECD_average_tax_wedge_as_percentage_of_labour_cost.svg)


.jpg)
.gif)


.jpg)
.jpg)
.gif)


_1950_-_2010.gif)


.png)


