Category:Subfields of statistics
Jump to navigation
Jump to search
Subcategories
This category has the following 29 subcategories, out of 29 total.
A
C
D
- Discriminant analysis (23 F)
E
F
- Factor analysis (9 F)
H
I
K
- Kernel density estimation (31 F)
- Kriging (17 F)
M
- Maximum likehood (4 F)
N
O
- Observer variation (33 F)
P
- Pareto principle (8 F)
Q
R
S
V
- Variogram (14 F)
W
Media in category "Subfields of statistics"
The following 45 files are in this category, out of 45 total.
-
 Alleged Luka Magnotta Murder Video View Statistical Data.png 1,189 × 268; 40 KB
-
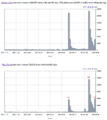
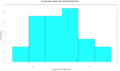 Banner25AoverBHISTredline.png 1,164 × 684; 34 KB
-
 Clickpath Analysis.png 1,228 × 789; 110 KB
-
 Context diagram for Statistical Analysis of Materials.jpg 641 × 697; 64 KB
-
 Correlation between two logical funktions.png 178 × 211; 4 KB
-
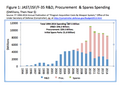 F-35 1994-2014.png 825 × 602; 57 KB
-
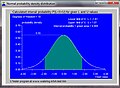
 F-TesterDensity.PNG 424 × 290; 6 KB
-
 F-TesterInverse.png 424 × 290; 8 KB
-
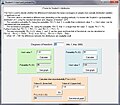
 F-TesterMain.png 686 × 481; 76 KB
-
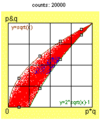
 F-wert.jpg 800 × 598; 31 KB
-
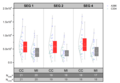 Grouped Box Chart with Color Indexed Data Points.png 1,695 × 1,179; 34 KB
-
 HistoFehler-1 Fit 2.png 696 × 474; 10 KB
-
 HistoFehler-SqrtBin Fit 2.png 696 × 472; 11 KB
-
 Impulsion avg.png 619 × 369; 11 KB
-
-
 K value.png 901 × 62; 9 KB
-
 K-means convergence to a local minimum.png 2,914 × 349; 25 KB
-
 K-means versus k-medoids.png 2,976 × 1,161; 108 KB
-
 KSTestMedianHouseprice.svg 475 × 265; 356 KB
-
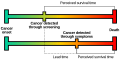 Lead time bias.svg 512 × 256; 2 KB
-
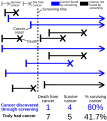 Length time bias.svg 341 × 384; 28 KB
-
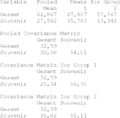
 Pales Emil Graf Rytmus lability politické moci v Egypte cs.pdf 1,239 × 872; 209 KB
-
 Pales Emil Graf Rytmus lability politické moci v Egypte.pdf 1,239 × 872; 232 KB
-
 Pales Emil Graf Rytmus Samael Sutech Nergal cs.pdf 1,239 × 1,752; 146 KB
-
 Pales Emil Graf Rytmus Samael Sutech Nergal.pdf 1,239 × 1,752; 145 KB
-
 Principal tree for Iris data set.png 1,240 × 720; 36 KB
-
 PSM V66 D376 Theoretical and actual distribution of grades.png 1,643 × 1,388; 438 KB
-
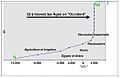 Qi histoire.jpg 546 × 355; 41 KB
-
 R-car stopping distances 1920+bootstrap1000.svg 360 × 360; 1.4 MB
-
 Schaetzungen Freizeitpark-Beispiel.png 673 × 661; 17 KB
-
 Shapiro-Wilk Simulated CDF for n = 5, 10, 15, ..., 50.svg 960 × 675; 499 KB
-
 SOM versus GSOM.png 1,248 × 859; 145 KB
-
 Spectramap Biplot Iris Flower Data Set FULL.jpg 1,064 × 680; 225 KB
-
 SVD Graphic Example.png 640 × 480; 33 KB
-
 T-TesterCum.jpg 519 × 381; 55 KB
-
 T-TesterInter.jpg 521 × 380; 63 KB
-
 T-TesterMain.jpg 680 × 594; 126 KB
-
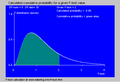
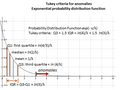
 Tukey anomaly criteria for Exponential PDF.png 696 × 546; 50 KB
-

-
-
 Variationsrechnung hut polynom6Ordnung.png 640 × 480; 4 KB
-
 Vindprod 1990-2014.jpg 970 × 604; 48 KB
-
 VR Domaine et schéma d'échantillonnage.tif 915 × 1,062; 46 KB
-
 WebTraffic-CMP-woody-mia-2014-02.png 863 × 966; 44 KB
-
 Wikipedia-stat-PacoDeLucía-dead-correlations.png 809 × 1,314; 57 KB


