Category:Statistics for Arctic sea ice melting
Jump to navigation
Jump to search
See also:
Media in category "Statistics for Arctic sea ice melting"
The following 19 files are in this category, out of 19 total.
-
2013 Daily Arctic Sea Ice from AMSR2 - May - September 2013.ogv 30 s, 1,920 × 1,080; 3.72 MB
-
 Arctic Sea Ice area thickness and volume trends.png 1,703 × 2,160; 2.05 MB
-
 Arctic Sea Ice Extent Anomaly 1953-2007.png 600 × 404; 36 KB
-
 Arctic sea ice extent timeline.png 1,050 × 840; 454 KB
-
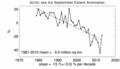 Arctic sea Ice September Extent Anomalies.png 1,260 × 720; 148 KB
-
 Arctic Sea Ice September Trend 1979-2007.jpg 2,511 × 1,650; 168 KB
-
 Arctic September Sea Ice Extent.png 1,500 × 1,413; 1.04 MB
-
 Arctice sea ice extent-de.svg 1,000 × 600; 177 KB
-
National Climate Assessment Annual Arctic Minimum Sea Ice Extents (1978-2012).ogv 30 s, 1,920 × 1,080; 1.35 MB
-
 Northern Hemisphere ice versus irradiance 1953.png 632 × 370; 122 KB
-
 Northern Hemisphere Sea Ice Extent Anomalies Italian.tif 1,260 × 720; 2.6 MB
-
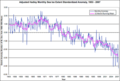
 Northern Hemisphere Sea Ice Extent Anomalies-Mar.png 1,727 × 872; 199 KB
-
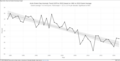 Northern Hemisphere Sea Ice Extent Anomalies-Sep.png 1,727 × 872; 216 KB
-
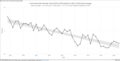
 Northern Hemisphere Sea Ice Extent Anomalies.png 1,260 × 720; 146 KB
-
 NSIDC arctic sea ice extent since 1979.svg 810 × 540; 37 KB
-
 Plot arctic sea ice volume.svg 810 × 540; 43 KB
-
 Seaice-1870-part-2009.png 840 × 759; 143 KB
-
 Seaice-extent-past1450y-Nature10581.svg 1,000 × 600; 174 KB
-
 北極と南極の海氷の変化.png 2,676 × 1,461; 202 KB


