Category:Soil science maps of the world
Jump to navigation
Jump to search
Media in category "Soil science maps of the world"
The following 65 files are in this category, out of 65 total.
-
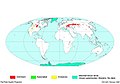
 Acrisol.png 500 × 351; 29 KB
-
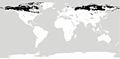
 Albeluvisol.png 500 × 351; 28 KB
-
 AlfisolWorld.jpg 377 × 184; 7 KB
-
 Alisol.png 500 × 350; 31 KB
-
 AndisolWorld.jpg 373 × 182; 5 KB
-
 Andosol.png 500 × 351; 28 KB
-
 Arenosol.png 500 × 351; 31 KB
-
 AridisolWorld.jpg 413 × 202; 8 KB
-
 Calcisol.png 500 × 351; 32 KB
-
 Cambisol.png 500 × 351; 33 KB
-
 Chernozem distribution.JPG 500 × 351; 21 KB
-
 Chernozem map.svg 576 × 292; 809 KB
-
 Durisol.png 500 × 350; 29 KB
-
 EntisolWorld.jpg 417 × 201; 9 KB
-
 FAO WRB world soils map.gif 1,450 × 895; 56 KB
-
 Ferralsol.gif 500 × 351; 27 KB
-
 Fluvisol.gif 500 × 351; 29 KB
-
 GelisolWorld.jpg 369 × 182; 7 KB
-
 Gleysol.gif 500 × 351; 30 KB
-
 Global Distribution of Soil Moisture Regimes.jpg 6,800 × 4,400; 2.48 MB
-
 Global Distribution of Soil Temperature Regimes.jpg 1,000 × 647; 133 KB
-
 Global Distribution of Soil-transmitted Helminths.png 1,158 × 766; 238 KB
-
 Global Soil Order Distribution.jpg 897 × 716; 134 KB
-
 Global Soil Orders Map.jpg 1,200 × 930; 1.47 MB
-
 Global soils map USDA.jpg 6,165 × 4,780; 6.67 MB
-
 Gypsisol.gif 500 × 351; 25 KB
-
 Histosol.gif 500 × 349; 27 KB
-
 HistosolWorld.jpg 416 × 202; 6 KB
-
 InceptisolWorld.jpg 415 × 200; 8 KB
-
 Inherent Land Quality Map.png 6,800 × 4,400; 937 KB
-
 Isric wosis points.png 1,021 × 602; 477 KB
-
 Kastanozem distribution.JPG 600 × 335; 28 KB
-
 Leptosol.gif 500 × 349; 33 KB
-
 Lixisol.gif 500 × 351; 27 KB
-
 Luvisol.gif 500 × 351; 26 KB
-

-

-
 MollisolWorld.jpg 416 × 203; 7 KB
-
 Nitisol.gif 500 × 351; 27 KB
-
 OxisolWorld.jpg 417 × 202; 7 KB
-
 Phaenozems.svg 576 × 292; 772 KB
-
 Phaeozem distribution.JPG 500 × 351; 21 KB
-
 Planosol.gif 500 × 351; 27 KB
-
 Plinthosol.gif 500 × 351; 25 KB
-
 Podzol map.svg 576 × 292; 734 KB
-
 Podzol.gif 500 × 285; 26 KB
-
 Rainfall erosivity estimates.jpg 1,280 × 779; 238 KB
-
 Regosol.gif 500 × 351; 29 KB
-
 Rüzgar erozyonu risk dağılımı.jpg 3,000 × 1,941; 2.78 MB
-
 SMAP Global Map of Surface Soil Moisture, 25-27 August 2015 (PIA19877).png 7,592 × 3,775; 1.9 MB
-
 Soil erosion change between 2015 and 2070.jpg 1,280 × 375; 125 KB
-
 Soil erosion estimates predicted through the GloSEM.jpg 1,280 × 797; 235 KB
-
 Soil moisture regimes.jpg 947 × 560; 140 KB
-
 Soils 6.jpg 5,475 × 2,644; 1.71 MB
-
 Solonchak.gif 500 × 351; 29 KB
-
 Solonetz.gif 500 × 351; 27 KB
-
 SpodosolWorld.jpg 418 × 201; 7 KB
-
 SWB wiki.png 3,543 × 2,530; 1.95 MB
-
 UltisolWorld.jpg 385 × 187; 7 KB
-
 Umbrisol.gif 500 × 351; 26 KB
-
 USDA soil taxonomy global map.png 6,165 × 4,780; 12.22 MB
-
 Vertisol.gif 500 × 349; 28 KB
-
 VertisolWorld.jpg 366 × 182; 5 KB
-
 World soil degradation.jpg 850 × 388; 77 KB
-
 World Soil pH.svg 940 × 477; 6.43 MB


.png)


