Category:SVG molecular biology
Jump to navigation
Jump to search
Subcategories
This category has only the following subcategory.
C
Media in category "SVG molecular biology"
The following 121 files are in this category, out of 121 total.
-
 0307 Osmosis cy.svg 544 × 308; 32 KB
-
 Acrylamide gel (zh-cn).svg 904 × 921; 123 KB
-
 Acrylamide gel.svg 904 × 921; 177 KB
-
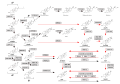 Androgen backdoor pathway.svg 1,315 × 916; 456 KB
-

-
 Applications of combinatorial gene circuit optimization strategies.svg 512 × 451; 217 KB
-

-

-
 Arabinose operon chemical reactions.svg 1,594 × 338; 113 KB
-
 ATAC-seq.svg 744 × 1,052; 1.13 MB
-

-
 Badan.svg 480 × 196; 23 KB
-
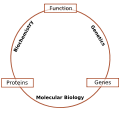
 Biochemistry, genetics and molecular biology.svg 854 × 759; 58 KB
-
 Biological cell vacuole.svg 1,466 × 891; 107 KB
-
 Biosensors used for screening combinatorial DNA libraries.svg 512 × 256; 122 KB
-
 Black lipid membrane.svg 709 × 590; 122 KB
-
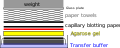 Capillary blot setup.svg 307 × 123; 43 KB
-
 ChIP-on-chip profile.svg 407 × 187; 235 KB
-
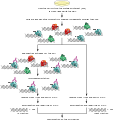 ChIP-on-chip protocol.svg 397 × 421; 1.2 MB
-
 ChIP-on-chip workflow overview-ru.svg 1,049 × 559; 20 KB
-
 ChIP-on-chip workflow overview.svg 1,049 × 559; 6 KB
-
 Chloroplast diagram (zh-cn).svg 920 × 680; 27 KB
-
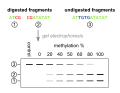 Cobra quantification.svg 990 × 765; 125 KB
-
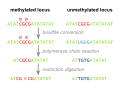 Cobra workflow.svg 990 × 765; 156 KB
-
 ColonneADN.svg 208 × 504; 13 KB
-

-
 Cosmid (English).svg 699 × 609; 32 KB
-
 Cosmid.svg 699 × 609; 22 KB
-
 Cosmid2.svg 699 × 609; 32 KB
-
 CRISPR overview - cy.svg 512 × 550; 33 KB
-
 Cut and Paste mechanism of transposition.svg 980 × 1,000; 124 KB
-
 DNA-ends.svg 580 × 226; 161 KB
-
 Duplex sequencing library preparation procedure.svg 1,053 × 1,559; 19 KB
-
 Duplex sequencing overview alphabeta fix.svg 1,417 × 1,536; 9.57 MB
-
 Duplex sequencing overview.svg 1,417 × 1,536; 5.48 MB
-
 Epissage.svg 565 × 222; 210 KB
-
 Fret.svg 640 × 439; 21 KB
-
 Gene2-plain (zh-cn).svg 1,395 × 1,182; 30 KB
-
 Gene2-plain-norsk.svg 1,395 × 1,182; 27 KB
-
 Gene2-plain.svg 1,395 × 1,182; 29 KB
-
 Golden Gate assembly.svg 512 × 787; 265 KB
-
 HMM Nucleotide Seq.svg 1,200 × 120; 29 KB
-
 HMM Nucleotides 2.svg 776 × 800; 49 KB
-
 Host-controlled restriction.svg 480 × 640; 445 KB
-
 How Pyrosequencing Works.svg 1,421 × 525; 758 KB
-
 Induction of iPS cells.svg 840 × 420; 12 KB
-
 Insulin path.svg 1,488 × 2,105; 282 KB
-
 Kapillarblot.svg 282 × 123; 42 KB
-
 Lac Operon.svg 512 × 382; 28 KB
-
 Les étapes de la construction de l'identité sexuelle et leur contrôle.svg 1,052 × 1,488; 141 KB
-
 LRR and BAF profiles for the T47D breast cancer cell line bottom.svg 406 × 203; 9.37 MB
-
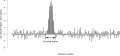
 LRR and BAF profiles for the T47D breast cancer cell line top.svg 407 × 196; 10.12 MB
-
 Lysogentic cycle diagram - Sarah Seifert-1.svg 512 × 384; 39 KB
-
 Lysogentic cycle diagram.svg 512 × 384; 38 KB
-
 Membrane potential ions en.svg 550 × 400; 185 KB
-
 Membrane potential ions it.svg 550 × 400; 185 KB
-
 Molbio barnstar.svg 373 × 373; 29 KB
-
 Molecular biologist.svg 843 × 635; 186 KB
-
 MRNA fr.svg 399 × 526; 212 KB
-
 MRNAcircle.svg 508 × 179; 109 KB
-
 MRNAsynthesis fr.svg 540 × 185; 100 KB
-
 MTOR illustration.svg 1,424 × 1,294; 145 KB
-
 Multalign.svg 467 × 94; 909 KB
-
 Mutual MMP activation.svg 731 × 595; 11 KB
-
 Nucleic acid.svg 512 × 276; 946 bytes
-
 Nucleotides 1 en kr.svg 820 × 290; 151 KB
-
 Operon.svg 1,851 × 981; 1.12 MB
-
 Opéron presence lactose numéros.svg 750 × 325; 18 KB
-
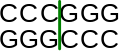
 Palindrom.svg 384 × 51; 81 KB
-
 Phospholipid Chemical Structure.svg 512 × 384; 68 KB
-
 Plant cell structure svg vacuole.svg 649 × 475; 99 KB
-
 Polyadenylation.svg 435 × 668; 44 KB
-
 Primers RevComp Annealed2.svg 1,028 × 536; 58 KB
-
 Primers RevComp Elongation2.svg 1,028 × 536; 65 KB
-
 Primers RevComp Melted2.svg 1,028 × 536; 61 KB
-
 Primers RevComp.svg 1,028 × 536; 58 KB
-
 PrincipeTechniqueMarquageMoleculaire.svg 1,052 × 744; 72 KB
-
 Processus de régénération du muscle strié squelettique.svg 2,048 × 2,042; 485 KB
-
 PromotorsK01589 logo 1.svg 1,200 × 1,200; 49 KB
-

-
 Quenching.svg 700 × 440; 5 KB
-
 Rancycle nuclearimport nuclearexport - ru.svg 490 × 254; 156 KB
-
 Rancycle nuclearimport nuclearexport.svg 490 × 254; 171 KB
-
 Regulacja ekspresji genu.svg 656 × 469; 108 KB
-

-
 Regulation of gene expression by steroid hormone receptor - Persian.svg 800 × 1,000; 694 KB
-
 Regulation of gene expression by steroid hormone receptor Bn.svg 800 × 1,000; 760 KB
-
 Regulation of gene expression by steroid hormone receptor.svg 800 × 1,000; 672 KB
-
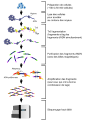
 ReverseGeneticsFlu-ar.svg 2,168 × 2,633; 1.98 MB
-
 RFLP genotyping gl.svg 379 × 208; 18 KB
-
 RFLP-figure.svg 640 × 480; 4 KB
-
 RFLPDemo1 gl.svg 350 × 106; 12 KB
-
 RFLPDemo2 gl.svg 332 × 96; 11 KB
-
 RNA agarose gel.svg 728 × 732; 198 KB
-
 RNA conservative replacement.svg 264 × 192; 28 KB
-
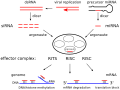 RNAi-simplified.svg 835 × 625; 26 KB
-

-
-
 Schematic workflow for generating complex combinatorial DNA libraries.svg 512 × 244; 627 KB
-
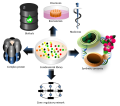
 Schematic workflow for microbial factory optimization.svg 512 × 819; 214 KB
-
 Sheets.svg 335 × 470; 22 KB
-
 Signal sequence.svg 620 × 148; 33 KB
-
 SiRNA mechanism.svg 960 × 720; 915 KB
-
 Site directed mutatgenesis.svg 2,029 × 834; 134 KB
-
 SmaI restriction enzyme recognition site.svg 165 × 70; 7 KB
-
 Splicing.svg 217 × 289; 24 KB
-
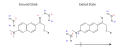
 Stk11.svg 987 × 467; 170 KB
-
 Supported bilayer.svg 635 × 288; 84 KB
-
 The three layers of NE proteins ru.svg 1,170 × 700; 128 KB
-
 The tRNA cloverleaf general-es.svg 1,020 × 1,263; 104 KB
-
 Transport von Hormonen.svg 512 × 390; 604 KB
-
 Transposition.svg 595 × 530; 169 KB
-
 Trp operon attenuation.svg 680 × 693; 248 KB
-
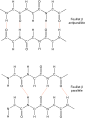
 Unionized Alpha Amino Acid Structure.svg 1,666 × 1,253; 19 KB
-
 Uzly-mezi-primarnim-a-sekundarnim-metabolismem.svg 907 × 907; 13 KB
-
 WikF1-en.svg 1,940 × 1,530; 347 KB
-
 Yeast Mating Type Chromasome Diagram EN.svg 468 × 157; 17 KB
-
 Сборка уровня 1 Golden Gate.svg 780 × 390; 96 KB
-
 Сборка уровня 2 Golden Gate .svg 811 × 404; 115 KB
-
 Сборка уровня 2 Golden Gate.svg 811 × 404; 115 KB
-
 生物化学、遗传学和分子生物学关系简图.svg 906 × 875; 51 KB

.svg)


.svg)


.svg)


.svg)


_domains_and_motifs.svg)