Category:SVG maps of the world by Our World in Data
Jump to navigation
Jump to search
Media in category "SVG maps of the world by Our World in Data"
The following 200 files are in this category, out of 930 total.
(previous page) (next page)-
 Above-ground biomass in forest per hectare, OWID.svg 850 × 600; 140 KB
-

-
 Access to clean fuels and technologies for cooking, OWID.svg 850 × 600; 141 KB
-

-

-

-
 Adolescent birth rate in women aged 10-19 years, OWID.svg 850 × 600; 140 KB
-
 Adolescent birth rate per 1,000 women aged 15-19, OWID.svg 850 × 600; 141 KB
-
 Adolescent birth rate, OWID.svg 850 × 600; 87 KB
-
 Adult literacy rate, population 15+ years, female (%), OWID.svg 850 × 600; 141 KB
-
 Adult literacy rate, population 15+ years, male (%), OWID.svg 850 × 600; 141 KB
-
 Adult literacy rates, 2015 or most recent observation, OWID.svg 850 × 600; 140 KB
-
 Age dependency ratio, OWID.svg 850 × 600; 154 KB
-
 Agricultural water as a share of total water withdrawals, OWID.svg 850 × 600; 140 KB
-
 Agricultural water withdrawals, OWID.svg 850 × 600; 141 KB
-
 Agricultural-area-per-capita (1).svg 850 × 600; 169 KB
-
 Agriculture orientation index for government expenditures, OWID.svg 850 × 600; 140 KB
-
 Agriculture value added per worker, OWID.svg 850 × 600; 141 KB
-
 Aid received per capita, OWID.svg 850 × 600; 140 KB
-
 Air transport, freight (ton-km), OWID.svg 850 × 600; 140 KB
-

-
 Alcohol consumption per person, OWID.svg 850 × 600; 141 KB
-
 Alcohol expenditure as a share of total household expenditure, OWID.svg 850 × 600; 140 KB
-
 Alcohol-attributable fraction of mortality, OWID.svg 850 × 600; 140 KB
-
 Annual CO₂ emissions, OWID.svg 850 × 600; 141 KB
-
 Annual freshwater withdrawals, OWID.svg 850 × 600; 141 KB
-
 Annual greenhouse gas emissions, OWID.svg 850 × 600; 140 KB
-
 Annual growth of GDP per capita, OWID.svg 850 × 600; 140 KB
-
 Annual healthcare expenditure per capita, OWID.svg 850 × 600; 140 KB
-
 Annual salary of primary teachers with 10 years of experience, OWID.svg 850 × 600; 141 KB
-
 Annual share of global CO₂ emissions, OWID.svg 850 × 600; 141 KB
-
 Annual-change-forest-area.svg 850 × 600; 168 KB
-
 Annual-deforestation.svg 850 × 600; 168 KB
-

-
 Antibiotic use in livestock, OWID.svg 850 × 600; 141 KB
-
 Anxiety disorder DALYs, age-standardized rate, OWID.svg 850 × 600; 140 KB
-
-
 Are married women required by law to obey their husbands., OWID.svg 850 × 600; 139 KB
-

-
 Asthma prevalence, OWID.svg 850 × 600; 140 KB
-
 Automated teller machines (ATMs), OWID.svg 850 × 600; 140 KB
-
 Average annual precipitation, OWID.svg 850 × 600; 143 KB
-
-
 Average height of women by year of birth, OWID.svg 850 × 600; 140 KB
-
 Average income of small-scale food producers, OWID.svg 850 × 600; 139 KB
-
 Average monthly precipitation, OWID.svg 850 × 600; 141 KB
-
 Average per capita alcohol consumption in 15-19 year olds, OWID.svg 850 × 600; 141 KB
-

-

-
 Average score for 4th graders on the TIMSS science assessment, OWID.svg 850 × 600; 140 KB
-
 Average test score in mathematics and science, OWID.svg 850 × 600; 141 KB
-
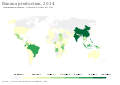 Banana production, OWID.svg 850 × 600; 140 KB
-
 Banana yields, OWID.svg 850 × 600; 140 KB
-
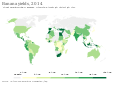
 Bean production, world map, OWID.svg 850 × 600; 154 KB
-
 Beef meat production, OWID.svg 850 × 600; 141 KB
-
 Beer as a share of total alcohol consumption, OWID.svg 850 × 600; 139 KB
-
 Beer consumption per person, OWID.svg 850 × 600; 141 KB
-
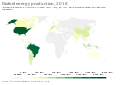 Biofuel energy production, OWID.svg 850 × 600; 141 KB
-
 Bipolar disorder DALYs, age-standardized rate, OWID.svg 850 × 600; 140 KB
-
 Burden of disease, OWID.svg 850 × 600; 142 KB
-
 Cancer incidence, OWID.svg 850 × 600; 140 KB
-
 Carbon-intensity-electricity.svg 850 × 600; 167 KB
-
 Cashew nut yields, OWID.svg 850 × 600; 147 KB
-
 Cattle meat per animal, OWID.svg 850 × 600; 140 KB
-
 Central government expenditure as share of GDP, OWID.svg 850 × 600; 141 KB
-
 Cereal yield, OWID.svg 850 × 600; 140 KB
-
 Chicken meat production, OWID.svg 850 × 600; 140 KB
-
 Chicken meat yields per animal, OWID.svg 850 × 600; 139 KB
-

-
 Child homicide rate, OWID.svg 850 × 600; 142 KB
-
 Child mortality (Long-run data; Gapminder and UN IGME), OWID.svg 850 × 600; 140 KB
-
 Child mortality from rotavirus, OWID.svg 850 × 600; 140 KB
-
 Child mortality rate (IHME, GBD), OWID.svg 850 × 600; 140 KB
-
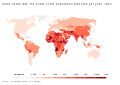
 Child mortality rate (UN IGME (1960 to 2017)), OWID.svg 850 × 600; 141 KB
-
 Child mortality rate (With SDG Target), OWID.svg 850 × 600; 140 KB
-
 Child mortality rate, including UN projections, OWID.svg 850 × 600; 139 KB
-
 Children born per woman, OWID.svg 850 × 600; 148 KB
-
 Children per woman (UN; 1950 to 2015), OWID.svg 850 × 600; 141 KB
-
 CO2 emissions per capita, 2016 (Our World in Data).svg 850 × 600; 155 KB
-
 CO2 emissions per capita, 2017 (Our World in Data).svg 850 × 600; 155 KB
-
 Coal consumption, OWID.svg 850 × 600; 141 KB
-
 Coal proved reserves, OWID.svg 850 × 600; 140 KB
-
 Coal-phase-out-timeline.svg 850 × 600; 168 KB
-
 Cocoa bean production, OWID.svg 850 × 600; 139 KB
-
 Cocoa bean yields, OWID.svg 850 × 600; 142 KB
-
 Coefficient of Variation (CV) in per capita caloric intake, OWID.svg 850 × 600; 143 KB
-
 Coffee bean production, OWID.svg 850 × 600; 140 KB
-
 Coffee bean yields, OWID.svg 850 × 600; 140 KB
-
 Commercial bank branches, OWID.svg 850 × 600; 141 KB
-
 Completeness of birth registration, OWID.svg 850 × 600; 141 KB
-
 Completeness of death reporting, OWID.svg 850 × 600; 140 KB
-
 Completion rate of lower secondary education, OWID.svg 850 × 600; 140 KB
-
 Condom use among men who have sex with men, OWID.svg 850 × 600; 141 KB
-
 Consumption of Ozone-Depleting Substances, OWID.svg 850 × 600; 140 KB
-
 Consumption-based CO₂ emissions per capita, OWID.svg 850 × 600; 140 KB
-
 Consumption-based CO₂ emissions, OWID.svg 850 × 600; 141 KB
-
 Contraceptive prevalence, any methods (% of women ages 15-49), OWID.svg 850 × 600; 141 KB
-
 Corruption Perception Index, OWID.svg 850 × 600; 142 KB
-
 Countries subscribed to the Montreal Protocol, OWID.svg 850 × 600; 139 KB
-
-
 Countries that are parties to the Nagoya Protocol, OWID.svg 850 × 600; 138 KB
-
 Country Programmable Aid (CPA) received, OWID.svg 850 × 600; 140 KB
-

-
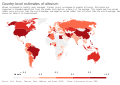 Country-level estimates of altruism, OWID.svg 850 × 600; 140 KB
-
 Country-level estimates of negative reciprocity, OWID.svg 850 × 600; 140 KB
-
 Country-level estimates of patience, OWID.svg 850 × 600; 140 KB
-
 Country-level estimates of positive reciprocity, OWID.svg 850 × 600; 140 KB
-
 Country-level estimates of risk taking, OWID.svg 850 × 600; 140 KB
-
 Country-level estimates of trust, OWID.svg 850 × 600; 139 KB
-

-

-
 Coverage of social insurance programs (% of population), OWID.svg 850 × 600; 140 KB
-
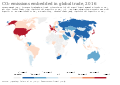 CO₂ emissions embedded in global trade, OWID.svg 850 × 600; 141 KB
-
 CO₂ emissions embedded in trade, OWID.svg 850 × 600; 141 KB
-
 CO₂ emissions per capita, OWID.svg 850 × 600; 140 KB
-
-
 Cumulative confirmed COVID-19 cases per million people, OWID.svg 850 × 600; 165 KB
-
 Cumulative confirmed COVID-19 cases, OWID.svg 850 × 600; 168 KB
-
 Cumulative confirmed COVID-19 deaths, OWID.svg 850 × 600; 164 KB
-
 Cumulative CO₂ emissions, OWID.svg 850 × 600; 141 KB
-

-
 Cumulative-co-emissions.svg 850 × 600; 168 KB
-
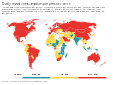 Daily meat consumption per person, OWID.svg 850 × 600; 139 KB
-
 Daily meat consumption per person.svg 850 × 600; 152 KB
-
 Daily new confirmed COVID-19 deaths per million people.svg 850 × 600; 165 KB
-

-
 Daily per capita caloric supply, OWID.svg 850 × 600; 142 KB
-
 Daily per capita fat supply, OWID.svg 850 × 600; 141 KB
-
 Daily per capita protein supply, OWID.svg 850 × 600; 143 KB
-
 Daily-smoking-prevalence-bounds.svg 850 × 600; 161 KB
-

-
 DALY rates from injuries, OWID.svg 850 × 600; 140 KB
-
 DALY rates from non-communicable diseases (NCDs), OWID.svg 850 × 600; 153 KB
-

-
 DALYs from mental health and substance use disorders, 1, OWID.svg 850 × 600; 141 KB
-

-
 DALYs rate from autistic spectrum disorders, OWID.svg 850 × 600; 140 KB
-
 Death rate attributed to an unsafe water source, OWID.svg 850 × 600; 140 KB
-
 Death rate from Alzheimer and other dementia, OWID.svg 850 × 600; 141 KB
-
 Death rate from ambient particulate air pollution, OWID.svg 850 × 600; 142 KB
-
 Death rate from amphetamine overdoses, OWID.svg 850 × 600; 141 KB
-
 Death rate from cardiovascular disease, OWID.svg 850 × 600; 141 KB
-
 Death rate from diarrheal diseases, OWID.svg 850 × 600; 141 KB
-
 Death rate from drowning, OWID.svg 850 × 600; 141 KB
-
 Death rate from fires and burns, OWID.svg 850 × 600; 141 KB
-
 Death rate from HIV-AIDS, OWID.svg 850 × 600; 140 KB
-
 Death rate from lead exposure, world map, OWID.svg 850 × 600; 153 KB
-
 Death rate from malnutrition, OWID.svg 850 × 600; 141 KB
-
 Death rate from natural disasters, OWID.svg 850 × 600; 141 KB
-
 Death rate from neonatal preterm birth complication, OWID.svg 850 × 600; 140 KB
-
 Death rate from obesity, OWID.svg 850 × 600; 141 KB
-
 Death rate from opioid overdoses, OWID-IT.svg 850 × 600; 150 KB
-
 Death rate from opioid overdoses, OWID.svg 850 × 600; 141 KB
-
 Death rate from road accidents, OWID (2017).svg 850 × 600; 142 KB
-
 Death rate from road accidents, OWID (2019).svg 850 × 600; 168 KB
-
 Death rate from suicides (IHME (1990 to 2016)), OWID.svg 850 × 600; 141 KB
-
 Death rate from tuberculosis, OWID.svg 850 × 600; 141 KB
-
 Death rate from unintentional poisoning, OWID.svg 850 × 600; 141 KB
-
 Death rate from unsafe sanitation, OWID.svg 850 × 600; 141 KB
-
 Death rate from venomous animal contact, OWID.svg 850 × 600; 140 KB
-
 Death rates from air pollution, 2, OWID.svg 850 × 600; 140 KB
-
 Death rates from alcohol and drug use disorders, OWID.svg 850 × 600; 141 KB
-
 Death rates from alcohol use disorders, OWID.svg 850 × 600; 142 KB
-
 Death rates from cocaine overdoses, OWID.svg 850 × 600; 141 KB
-
 Death rates from conflict and terrorism, OWID.svg 850 × 600; 141 KB
-
 Death rates from drug use disorders, OWID.svg 850 × 600; 141 KB
-
 Death rates from eating disorders, OWID.svg 850 × 600; 140 KB
-
 Death rates from indoor air pollution, OWID.svg 850 × 600; 140 KB
-
 Death rates from mental health and substance use disorders, OWID.svg 850 × 600; 141 KB
-
 Death rates from pneumonia in children under 5, OWID.svg 850 × 600; 140 KB
-
 Death rates from substance use disorders, OWID.svg 850 × 600; 141 KB
-
 Death rates from unsafe sanitation, OWID.svg 850 × 600; 140 KB
-
 Death rates from unsafe water sources, OWID.svg 850 × 600; 140 KB
-
 Death-rate-from-obesity-es.svg 850 × 600; 191 KB
-
 Death-rate-from-obesity.svg 850 × 600; 168 KB
-
 Death-rate-smoking,1990.svg 850 × 600; 152 KB
-
 Death-rate-smoking,1991.svg 850 × 600; 152 KB
-
 Death-rate-smoking,1992.svg 850 × 600; 152 KB
-
 Death-rate-smoking,1993.svg 850 × 600; 152 KB
-
 Death-rate-smoking,1994.svg 850 × 600; 152 KB
-
 Death-rate-smoking,1995.svg 850 × 600; 152 KB
-
 Death-rate-smoking,1996.svg 850 × 600; 152 KB
-
 Death-rate-smoking,1997.svg 850 × 600; 152 KB
-
 Death-rate-smoking,1998.svg 850 × 600; 152 KB
-
 Death-rate-smoking,1999.svg 850 × 600; 152 KB
-
 Death-rate-smoking,2000.svg 850 × 600; 152 KB
-
 Death-rate-smoking,2001.svg 850 × 600; 152 KB
-
 Death-rate-smoking,2002.svg 850 × 600; 152 KB
-
 Death-rate-smoking,2003.svg 850 × 600; 152 KB
-
 Death-rate-smoking,2004.svg 850 × 600; 152 KB
-
 Death-rate-smoking,2005.svg 850 × 600; 152 KB
-
 Death-rate-smoking,2006.svg 850 × 600; 152 KB
-
 Death-rate-smoking,2007.svg 850 × 600; 152 KB
-
 Death-rate-smoking,2008.svg 850 × 600; 152 KB
-
 Death-rate-smoking,2009.svg 850 × 600; 152 KB
-
 Death-rate-smoking,2010.svg 850 × 600; 152 KB
-
 Death-rate-smoking,2011.svg 850 × 600; 152 KB
-
 Death-rate-smoking,2012.svg 850 × 600; 152 KB
-
 Death-rate-smoking,2013.svg 850 × 600; 152 KB
-
 Death-rate-smoking,2014.svg 850 × 600; 152 KB


,_OWID.svg)
,_OWID.svg)
,_OWID.svg)


,_OWID.svg)
,_OWID.svg)


.svg)


,_OWID.svg)

),_OWID.svg)


,_OWID.svg)

,_OWID.svg)
),_OWID.svg)
,_OWID.svg)


,_OWID.svg)
.svg)
.svg)


_in_per_capita_caloric_intake,_OWID.svg)


,_OWID.svg)


,_OWID.svg)

_received,_OWID.svg)


,_OWID.svg)


,_OWID.svg)
_from_mental_and_neurodevelopmental_disorders,_OWID.svg)

,_OWID.svg)


.svg)
.svg)
),_OWID.svg)


,_OWID.svg)
_for_preventing_mother-to-child_transmission_(MTCT),_OWID.svg)