Category:SVG maps by Allice Hunter
Jump to navigation
Jump to search
Subcategories
This category has only the following subcategory.
E
Media in category "SVG maps by Allice Hunter"
The following 183 files are in this category, out of 183 total.
-
 2018 UN Human Development Report (inequality-adjusted).svg 512 × 230; 767 KB
-
 2018 UN Human Development Report.svg 512 × 230; 767 KB
-
 2019 UN Human Development Report (inequality-adjusted).svg 512 × 230; 810 KB
-
 2019 UN Human Development Report.svg 512 × 230; 799 KB
-
 2020 UN Human Development Report (inequality-adjusted).svg 2,192 × 1,135; 1.62 MB
-
 2020 UN Human Development Report.svg 2,192 × 1,135; 1.62 MB
-
 2021-22 UN Human Development Report (inequality-adjusted).svg 2,192 × 1,135; 1.64 MB
-
 2021-22 UN Human Development Report (multicolor).svg 2,192 × 1,135; 1.64 MB
-
 2021-22 UN Human Development Report.svg 2,192 × 1,135; 1.64 MB
-
 Administrative divisions of China by HDI (2017).svg 512 × 427; 122 KB
-
 Administrative divisions of China by HDI (2019).svg 512 × 427; 115 KB
-
 Anglospeak (subnational version).svg 2,437 × 1,064; 856 KB
-
 Angolan provinces by HDI (2017).svg 512 × 546; 134 KB
-
 Armenian provinces by HDI (2017).svg 512 × 523; 83 KB
-
 Australian states by GSP (2018–19).svg 512 × 469; 58 KB
-
 Australian states by GSP per capita (2018–19).svg 512 × 469; 58 KB
-
 Australian states by HDI (2017).svg 512 × 469; 60 KB
-
 Austrian states by HDI (2017).svg 512 × 278; 72 KB
-
 Belgian provinces by HDI (2017).svg 512 × 448; 142 KB
-
 Blank map of the Portuguese regions.svg 721 × 1,122; 149 KB
-
 Bolivian departments by HDI (2017).svg 512 × 584; 190 KB
-
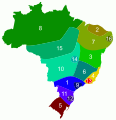
 Brazilian states by HDI (2017).svg 512 × 521; 203 KB
-
 Brazilian States by Population (2018).svg 774 × 872; 247 KB
-
 Can provinces and territories by population in 2016.svg 1,337 × 1,358; 149 KB
-
 Canada Location Map (2017) with Yellowknife and Saskatoon.svg 512 × 512; 2.46 MB
-
 Canadian provinces and territories by GDP (2021).svg 1,114 × 942; 232 KB
-
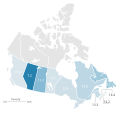
 Canadian provinces and territories by HDI (2015).svg 512 × 493; 103 KB
-
 Canadian provinces and territories by HDI (2018).svg 512 × 493; 91 KB
-
 Canadian provinces and territories by HDI (2019).svg 512 × 493; 48 KB
-
 Capitais do Brasil por IFDM (2018).svg 916 × 890; 506 KB
-
 Colombian departments by HDI (2017).svg 512 × 697; 354 KB
-
 Counties of Croatia by HDI (2018).svg 512 × 514; 254 KB
-

-
 Countries with Very High HDI in the 2019 Human Development Index Report.svg 2,192 × 1,135; 1.64 MB
-
 Districts of Pakistan by HDI (2015).svg 512 × 480; 93 KB
-
 Dutch provinces by HDI (2017).svg 512 × 621; 102 KB
-
 Ecuadorian provinces by HDI (2017).svg 512 × 614; 242 KB
-
 Estados brasileiros por expectativa de vida (2020).svg 767 × 763; 167 KB
-
 Estados brasileiros por incidência da pobreza (2021).svg 767 × 763; 167 KB
-
 Estados brasileiros por índice de transparência (2022).svg 767 × 763; 226 KB
-
 European countries by GDP nominal (2020).svg 680 × 520; 622 KB
-
 European countries by GDP nominal per capita (2020).svg 680 × 520; 642 KB
-
 European countries by GDP nominal per capita (2021).svg 680 × 520; 642 KB
-
 European countries by HDI (2019).svg 680 × 520; 621 KB
-
 European countries by HDI (2021).svg 680 × 520; 649 KB
-
 European countries by life expectancy (2020).svg 680 × 520; 649 KB
-
 European countries by population (2020-2022).svg 680 × 520; 649 KB
-
 European countries by population growth rate (2021).svg 680 × 520; 649 KB
-
 European countries by population growth rate (2022).svg 680 × 520; 649 KB
-
 FAO Hunger Map 2019-2021.svg 2,192 × 1,135; 1.64 MB
-
 Federal subjects of Russia by HDI (2016).svg 512 × 303; 180 KB
-
 German states by HDI (2017).svg 512 × 728; 123 KB
-
 German states by HDI (2018).svg 512 × 624; 128 KB
-
 Governorates of Egypt by HDI (2017).svg 512 × 492; 245 KB
-
 Governorates of Iraq by HDI (2017).svg 512 × 513; 142 KB
-
 Hispanophone global world map language.svg 512 × 282; 837 KB
-
 Hunger Map 2020 World Food Programme.svg 2,192 × 1,135; 1.62 MB
-
 Hunger Map 2021 World Food Programme.svg 2,192 × 1,135; 1.62 MB
-
 IMF advanced economies and UN least developed countries.svg 2,192 × 1,135; 1.64 MB
-
 Indian states and territories by HDI (2017).svg 512 × 612; 203 KB
-
 Indonesian provinces by HDI (2019).svg 512 × 213; 347 KB
-
 Iranian provinces by HDI (2017).svg 512 × 490; 134 KB
-
 Japanese prefectures by HDI (2017).svg 512 × 547; 311 KB
-
 Köppen World Map Af.svg 3,000 × 1,502; 4.63 MB
-
 Köppen World Map Am.svg 3,000 × 1,499; 4.63 MB
-
 Köppen World Map Aw.svg 3,000 × 1,490; 4.63 MB
-
 Köppen World Map BS.svg 3,000 × 1,493; 4.63 MB
-
 Köppen World Map BW.svg 3,000 × 1,490; 4.63 MB
-
 Köppen World Map Cfa and Cwa (Humid subtropical).svg 3,000 × 1,490; 4.63 MB
-
 Köppen World Map Cfb, Cfc, Cwb and Cwc (Oceanic).svg 3,000 × 1,487; 4.63 MB
-
 Köppen World Map Cs.svg 3,000 × 1,481; 4.63 MB
-
 Köppen World Map Cwb and Cfb (Highland).svg 3,000 × 1,602; 4.63 MB
-

-
 Köppen World Map Dsa, Dwa and Dfa (Hot summer continental).svg 3,000 × 1,493; 4.63 MB
-
 Köppen World Map Dsa, Dwa, Dfa, Dsb, Dwb and Dfb (Humid continental).svg 512 × 256; 3.09 MB
-
 Köppen World Map Dsb, Dwb and Dfb (Warm summer continental).svg 3,000 × 1,502; 4.63 MB
-
 Köppen World Map Dsc, Dwc, Dfc, Dsd, Dwd and Dfd (Subarctic).svg 3,000 × 1,490; 4.63 MB
-
 Köppen World Map EF (Ice cap).svg 3,000 × 1,499; 4.63 MB
-
 Köppen World Map ET (Tundra).svg 3,000 × 1,487; 4.63 MB
-
 Köppen World Map ET and EF (Polar).svg 512 × 253; 3.09 MB
-
 Map of countries by Corruption Perceptions Index (2021).svg 2,192 × 1,135; 1.63 MB
-
 Map of countries by EF English Proficiency Index (2021).svg 2,192 × 1,135; 1.62 MB
-
 Map of countries by GDP (nominal) per capita in 2021.svg 2,192 × 1,135; 1.62 MB
-
 Map of countries by GDP (nominal) per capita in 2022.svg 2,192 × 1,135; 2.18 MB
-
 Map of countries by GDP (nominal) per capita in 2023.svg 2,192 × 1,135; 1.64 MB
-
 Map of countries by GDP (PPP) per capita in 2021.svg 2,192 × 1,135; 1.62 MB
-
 Map of countries by GDP (PPP) per capita in 2022.svg 2,192 × 1,135; 1.64 MB
-
 Map of countries by GDP (PPP) per capita in 2023.svg 2,192 × 1,135; 1.64 MB
-
 Map of countries by GINI coefficient (1990 to 2020).svg 2,192 × 1,135; 1.63 MB
-
 Map of countries by Global Peace Index (2021).svg 2,192 × 1,135; 1.62 MB
-
 Map of countries by Global Peace Index (2022).svg 2,192 × 1,135; 1.64 MB
-
 Map of countries by Index of Economic Freedom (2023).svg 2,192 × 1,135; 1.64 MB
-
 Map of countries by intentional homicide rate (2006 – 2018).svg 2,192 × 1,135; 1.64 MB
-
 Map of countries by suicide rate, WHO (2019).svg 2,192 × 1,135; 1.63 MB
-
 Map of European countries by GDP (PPP) per capita in 2021.svg 440 × 319; 671 KB
-
 Map of Ontario Toronto (highlighted).svg 340 × 330; 52 KB
-
 Map of the Brazilian regions by literacy rate (2019).svg 512 × 512; 172 KB
-
 Map of the Brazilian states by literacy rate (2019).svg 512 × 512; 157 KB
-

-
 Map of the megadiverse countries.svg 2,192 × 1,135; 1.64 MB
-
 Map of the Portuguese language in the world (SVG).svg 512 × 243; 799 KB
-
 Map of the U.S. states by Human Development Index (2018).svg 512 × 354; 81 KB
-
 Map of U.S. states by American Human Development Index 2016.svg 959 × 650; 113 KB
-
 Map of U.S. states by Human Development Index (2017).svg 512 × 350; 85 KB
-
 Map of U.S. states by Human Development Index 2015.svg 957 × 663; 113 KB
-
 Mapa das regiões brasileiras por PIB em 2020.svg 767 × 763; 188 KB
-
 Mapa das regiões brasileiras por renda per capita (2022).svg 780 × 758; 198 KB
-
 Mapa das regiões portuguesas por PIB.svg 721 × 1,122; 155 KB
-
 Mapa do IDH da Bahia (2010).svg 512 × 571; 506 KB
-
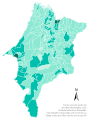
 Mapa do IDH da Paraíba (2010).svg 512 × 344; 186 KB
-
 Mapa do IDH de Alagoas (2010).svg 512 × 304; 108 KB
-
 Mapa do IDH de Goiás (2010).svg 512 × 528; 512 KB
-
 Mapa do IDH de Mato Grosso (2010).svg 512 × 519; 584 KB
-
 Mapa do IDH de Mato Grosso do Sul (2010).svg 512 × 519; 331 KB
-
 Mapa do IDH de Minas Gerais (2010).svg 512 × 423; 1.21 MB
-
 Mapa do IDH de Pernambuco (2010).svg 512 × 189; 154 KB
-
 Mapa do IDH de Rondônia (2010).svg 512 × 451; 234 KB
-
 Mapa do IDH de Roraima (2010).svg 512 × 645; 125 KB
-
 Mapa do IDH de Santa Catarina (2010).svg 512 × 361; 398 KB
-
 Mapa do IDH de Sergipe (2010).svg 512 × 605; 112 KB
-
 Mapa do IDH de São Paulo (2010).svg 512 × 328; 645 KB
-
 Mapa do IDH do Acre (2010).svg 512 × 303; 137 KB
-
 Mapa do IDH do Amapá (2010).svg 512 × 612; 125 KB
-
 Mapa do IDH do Amazonas (2010).svg 512 × 384; 389 KB
-
 Mapa do IDH do Ceará (2010).svg 512 × 656; 252 KB
-
 Mapa do IDH do Distrito Federal (2010).svg 512 × 343; 239 KB
-
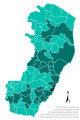 Mapa do IDH do Espírito Santo (2010).svg 512 × 768; 166 KB
-
 Mapa do IDH do Maranhão (2010).svg 512 × 686; 384 KB
-
 Mapa do IDH do Paraná (2010).svg 512 × 352; 610 KB
-
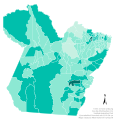 Mapa do IDH do Pará (2010).svg 512 × 537; 517 KB
-
 Mapa do IDH do Piauí (2010).svg 512 × 725; 225 KB
-
 Mapa do IDH do Rio de Janeiro (2010).svg 512 × 375; 200 KB
-
 Mapa do IDH do Rio Grande do Norte (2010).svg 512 × 335; 142 KB
-
 Mapa do IDH do Rio Grande do Sul (2010).svg 512 × 518; 638 KB
-
 Mapa do IDH do Tocantins (2010).svg 512 × 794; 368 KB
-
 Mapa dos estados brasileiros por avanço do IDH (1991-2021).svg 775 × 758; 205 KB
-
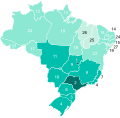
 Mapa dos estados brasileiros por IDH (1991).svg 775 × 758; 205 KB
-
 Mapa dos estados brasileiros por IDH (2000).svg 775 × 758; 205 KB
-
 Mapa dos estados brasileiros por IDH (2010).svg 775 × 758; 205 KB
-
 Mapa dos estados brasileiros por IDH (2021).svg 775 × 758; 205 KB
-
 Mapa dos estados brasileiros por população (2022).svg 775 × 758; 204 KB
-
 Mapa dos estados brasileiros por renda per capita (2022).svg 780 × 758; 205 KB
-
 Mexican states by HDI (2012).svg 512 × 369; 154 KB
-
 Mexican states by HDI (2019).svg 512 × 350; 150 KB
-
 Origin of the European and Arab immigrants in Brazil.svg 680 × 520; 622 KB
-
 Peruvian departments by HDI (2017).svg 512 × 728; 89 KB
-
 Polish voivodeships by HDI (2017).svg 512 × 512; 92 KB
-
 Portugueselanguagedialects-Brazil (colored).svg 512 × 530; 30 KB
-
 Poverty in Canadian Provinces.svg 512 × 481; 61 KB
-
 Provinces of Argentina by HDI (2016).svg 512 × 1,251; 246 KB
-
 Provinces of Argentina by HDI (2021).svg 512 × 1,251; 224 KB
-
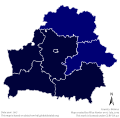 Regions of Belarus by HDI (2017).svg 512 × 503; 183 KB
-
 Regions of Chile by HDI (2017).svg 512 × 1,889; 534 KB
-
 Regions of Denmark by HDI (2017).svg 512 × 633; 135 KB
-
 Regions of Finland by HDI (2017).svg 512 × 902; 106 KB
-
 Regions of France by HDI (2017).svg 512 × 524; 104 KB
-
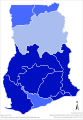 Regions of Ghana by HDI (2017).svg 512 × 735; 132 KB
-
 Regions of Hungary by HDI (2017).svg 512 × 333; 121 KB
-
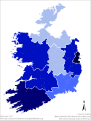 Regions of Ireland by HDI (2017).svg 512 × 676; 409 KB
-
 Regions of Italy by HDI (2017).svg 512 × 629; 236 KB
-
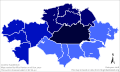 Regions of Kazakhstan by HDI (2018).svg 512 × 306; 208 KB
-
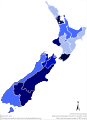 Regions of New Zealand by HDI (2017).svg 512 × 705; 224 KB
-
 Regions of Norway by HDI (2017).svg 512 × 557; 76 KB
-
 Regions of Portugal by HDI (2017).svg 512 × 885; 207 KB
-
 Regions of Portugal by HDI (2019).svg 512 × 885; 501 KB
-
 Regions of South Korea by HDI (2017).svg 512 × 792; 287 KB
-
 Regions of Sweden by HDI (2017).svg 512 × 1,192; 105 KB
-
 Regions of Switzerland by HDI (2018).svg 512 × 347; 169 KB
-
 Regions of the United Kingdom by HDI (2017).svg 512 × 909; 1.18 MB
-
 Regions of Turkey by HDI (2017).svg 512 × 263; 275 KB
-
 Regions of Turkey by HDI (2018).svg 512 × 263; 271 KB
-
 Regions of Ukraine by HDI (2017).svg 512 × 352; 494 KB
-
 Região Intermediária de Ji-Paraná, Rondônia.svg 512 × 429; 106 KB
-
 Região Intermediária de Porto Velho, Rondônia.svg 512 × 429; 101 KB
-
 Regiões de Portugal por PIB (2021).svg 512 × 885; 216 KB
-
 Regiões Geográficas do Estado de Rondônia.svg 512 × 429; 151 KB
-
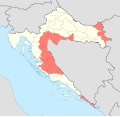 RSK and Yugoslav Army-held areas in Croatia in early 1992.svg 512 × 496; 233 KB
-
 South African provinces by HDI (2017).svg 512 × 453; 273 KB
-
 Spanish autonomous communities by HDI (2017).svg 512 × 431; 216 KB
-
 Uruguayan departments by HDI (2017).svg 512 × 589; 90 KB
-
 Uruguayan departments by HDI (2021).svg 512 × 589; 444 KB
-
 Venezuelan states by HDI (2017).svg 512 × 447; 90 KB
-
 Western world and culture.svg 2,571 × 1,323; 1.2 MB
.svg)

.svg)

.svg)

.svg)
.svg)

.svg)
.svg)
.svg)
.svg)
.svg)
.svg)
.svg)
.svg)
.svg)
.svg)
.svg)
.svg)
.svg)

_with_Yellowknife_and_Saskatoon.svg)
.svg)
.svg)
.svg)
.svg)
.svg)
.svg)
.svg)
.svg)

.svg)
.svg)
.svg)
.svg)
.svg)
.svg)
.svg)
.svg)
.svg)
.svg)
.svg)
.svg)
.svg)
.svg)

.svg)
.svg)
.svg)
.svg)
.svg)


.svg)
.svg)
.svg)
.svg)


.svg)
.svg)

.svg)
.svg)
.svg)
.svg)
.svg)
.svg)
.svg)
.svg)
.svg)
.svg)
.svg)
_per_capita_in_2021.svg)
_per_capita_in_2022.svg)
_per_capita_in_2023.svg)
_per_capita_in_2021.svg)
_per_capita_in_2022.svg)
_per_capita_in_2023.svg)
.svg)
.svg)
.svg)
.svg)
.svg)
.svg)
_per_capita_in_2021.svg)
.svg)
.svg)
.svg)
.svg)

.svg)
.svg)

.svg)


.svg)

.svg)
.svg)
.svg)
.svg)
.svg)
.svg)
.svg)
.svg)
.svg)
.svg)
.svg)
.svg)
.svg)
.svg)
.svg)
.svg)
.svg)
.svg)
.svg)
.svg)
.svg)
.svg)
.svg)
.svg)
.svg)
.svg)
.svg)
.svg)
.svg)
.svg)
.svg)
.svg)
.svg)
.svg)
.svg)

.svg)
.svg)
.svg)

.svg)
.svg)
.svg)
.svg)
.svg)
.svg)
.svg)
.svg)
.svg)
.svg)
.svg)
.svg)
.svg)
.svg)
.svg)
.svg)
.svg)
.svg)
.svg)
.svg)


.svg)


.svg)
.svg)
.svg)
.svg)
.svg)

.svg)
.svg)
.svg)
.svg)
.svg)