Category:SVG diagrams of human cone cell spectral sensitivity curves
Jump to navigation
Jump to search
Media in category "SVG diagrams of human cone cell spectral sensitivity curves"
The following 16 files are in this category, out of 16 total.
-
 1416 Color Sensitivity fr.svg 529 × 333; 59 KB
-
 1416 Color Sensitivity.svg 1,059 × 665; 61 KB
-
 Cone-absorbance-de.svg 550 × 346; 15 KB
-
 Cone-absorbance-en.svg 550 × 346; 9 KB
-
 Cone-fundamentals-with-srgb-spectrum.svg 540 × 380; 5 KB
-
 Cone-response et.svg 550 × 346; 12 KB
-
 Cone-response-de(2).svg 550 × 346; 16 KB
-
 Cone-response-fr.svg 550 × 346; 15 KB
-
 Cone-response-pl.svg 550 × 346; 11 KB
-
 Cone-response-ru.svg 521 × 326; 3 KB
-
 Cone-response-uk.svg 512 × 322; 46 KB
-
 Cones SMJ2 E.svg 287 × 217; 21 KB
-
 Metamerism spectrum example.svg 512 × 768; 7 KB
-
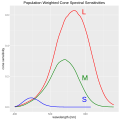 Population weighted cone spectral sensitivities.svg 512 × 512; 5 KB
-
 Spectre absorption des cones.svg 673 × 531; 14 KB
-
 Stockmansharpe10degCMFadj2000 popconsens.svg 512 × 512; 87 KB


.svg)


