Category:Radiation graphs of Fukushima prefecture
Jump to navigation
Jump to search
Media in category "Radiation graphs of Fukushima prefecture"
The following 12 files are in this category, out of 12 total.
-
 Fukushima I accidents Daini NPS radiation.png 930 × 620; 85 KB
-
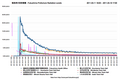
 Fukushima I Accidents Fukushima Iod-131 tap water contamination.png 930 × 620; 127 KB
-
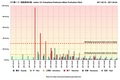
 Fukushima I radiation, Fukushima Prefecture 1, March-April 2011.png 930 × 630; 131 KB
-
 Fukushima I radiation, Fukushima Prefecture 2, March 2011.png 930 × 620; 124 KB
-
 Fukushima I radiation, Fukushima Prefecture 2, March-April 2011.png 930 × 620; 124 KB
-
 Fukushima I radiation, Fukushima Prefecture 3, March-April 2011.png 930 × 620; 97 KB
-
 FukushimaOutlyingRadiationPlot-Log-Mar17-00h00.png 1,200 × 511; 65 KB
-
 FukushimaOutlyingRadiationPlot-Log-Mar17-14h00.png 1,200 × 511; 69 KB
-
 FukushimaOutlyingRadiationPlot-Log-Mar19.png 1,200 × 464; 86 KB
-
 Radioactivity levels around Fukushima-Daiichi, March 15-16.png 685 × 398; 43 KB
-
 Radioactivité ambiante, Iitate, 15-16 mars.JPG 977 × 600; 49 KB
-
 Radioactivité ambiante, Iitate, 15-25 mars.JPG 977 × 600; 58 KB

