Category:Pulsar diagrams
Jump to navigation
Jump to search
Media in category "Pulsar diagrams"
The following 22 files are in this category, out of 22 total.
-
Correlation vs angular separation between pulsars.svg 512 × 341; 6 KB
-
Darbe sekli.gif 579 × 196; 3 KB
-
Diagram explaining the geometry of a pulsar.jpg 774 × 576; 89 KB
-
Doublesystar.gif 180 × 150; 9 KB
-
Istogrammi della variabile.png 542 × 414; 36 KB
-
Numero di stelle del campione.png 508 × 394; 29 KB
-
Ppdot.png 512 × 512; 78 KB
-
PPdot2.png 1,600 × 1,120; 289 KB
-
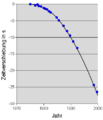
PSR 1913+16 orbital decay.png 435 × 483; 16 KB
-
PSR B1913+16 periastron shift graph.svg 450 × 500; 109 KB
-
PSR B1913+16 period shift graph CZ.svg 447 × 514; 113 KB
-
PSR B1913+16 period shift graph PT.svg 447 × 514; 114 KB
-
PSR B1913+16 period shift graph.svg 450 × 500; 110 KB
-
Psr1913+16-weisberg en.png 415 × 483; 6 KB
-
Psr1913+16-weisberg.png 415 × 483; 7 KB
-
PSRJ0737−3039shift2021.png 351 × 500; 52 KB
-
Pulsar spectrum.svg 433 × 462; 39 KB
-
Pulsars in the sky.svg 1,294 × 722; 777 KB
-
Scatterplot di 2 variabili.png 528 × 413; 50 KB
-
Ssc2006-10a.jpg 3,000 × 2,400; 1.13 MB


