Category:Population diagrams of Frankfurt am Main
Jump to navigation
Jump to search
Media in category "Population diagrams of Frankfurt am Main"
The following 20 files are in this category, out of 20 total.
-
 Climatediagram-metric-english-FrankfurtMain-Germany-1961-1990.png 1,000 × 685; 64 KB
-
 Einwohnerentwicklung Frankfurt(M).jpg 1,328 × 806; 89 KB
-
 Einwohnerentwicklung von Frankfurt-Bergen-Enkheim.svg 800 × 400; 58 KB
-
 Flächennutzung Frankfurt-Sindlingen.png 641 × 742; 18 KB
-
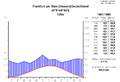
 Frankfurt Hoechst Einwohnerentwicklung.jpg 1,213 × 754; 88 KB
-
 Frankfurt Hoechst Einwohnerentwicklung.png 1,819 × 1,131; 322 KB
-
 FRANKFURT M SINDLINGEN nieder.svg 512 × 427; 21 KB
-
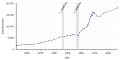
 Frankfurt population (Ab 1871).svg 800 × 400; 33 KB
-
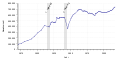
 Frankfurt population (Ab 1971).svg 800 × 400; 21 KB
-
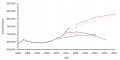 Frankfurt population - Prognosen.svg 800 × 400; 29 KB
-
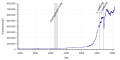 Frankfurt population.svg 800 × 400; 36 KB
-
 Klimadiagramm-metrisch-deutsch-FrankfurtMain-Deutschland-1961-1990.png 1,000 × 685; 64 KB
-
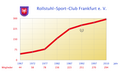 Rsc frankfurt member statistics.png 1,920 × 1,200; 598 KB
-
 Seckbach inhabitants age groups.png 1,920 × 1,080; 393 KB
-
 Seckbach inhabitants.png 1,920 × 1,080; 182 KB
-
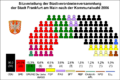 Sitzverteilung Stadtverordnetenversammlung Frankfurt am Main 2006.png 1,421 × 948; 153 KB
-

-
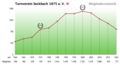 Tv seckbach 1875 mitgliederstatistik.png 1,920 × 1,080; 282 KB
-
 Verkehrszahlen Flughafen Frankfurt.png 1,120 × 764; 34 KB
-
 Vyvoj poctu obavatelov vo Frankfurte nad Mohanom.jpg 1,328 × 806; 120 KB

.jpg)


.svg)
.svg)


