Category:Population density maps of the United States
Jump to navigation
Jump to search
Pages in category "Population density maps of the United States"
This category contains only the following page.
Media in category "Population density maps of the United States"
The following 190 files are in this category, out of 190 total.
-
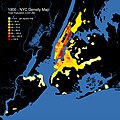 1900 NYC Density Map.jpg 8,775 × 8,775; 12.9 MB
-
 2010 Kansas Census Data.jpg 2,200 × 1,700; 238 KB
-
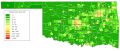 2010populationdensityoklahoma.svg 1,173 × 489; 3.88 MB
-
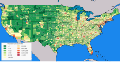 2010unitedstatespopulationdensity.svg 3,503 × 1,788; 2.67 MB
-
 A map showing the majority racial or ethnic group in Connecticut by census block.png 10,367 × 8,732; 2.82 MB
-
 Alabama population map.png 600 × 600; 195 KB
-
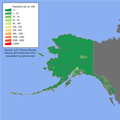 Alaska population map.png 600 × 600; 97 KB
-
 Amarillo Texas - Persons Per Square Mils - Census 2000.png 576 × 443; 26 KB
-
 Arizona population map.png 600 × 600; 116 KB
-
 Arkansas population map.png 504 × 446; 128 KB
-

-

-
 Boswash.png 2,000 × 2,667; 1.81 MB
-
 California population map.png 600 × 600; 161 KB
-
 Census Bureau Czechs in the United States.gif 498 × 373; 13 KB
-
 Census Bureau French Canadians in the United States.gif 573 × 423; 16 KB
-
 Child density according to the school census.jpg 3,364 × 2,602; 1.09 MB
-
 Choropleth-density.png 800 × 600; 458 KB
-
 Choropleth-density.svg 1,000 × 750; 2.19 MB
-
 Cities in the United States.png 1,370 × 854; 64 KB
-
 Colorado population map.png 700 × 400; 109 KB
-
 Connecticut population map.png 700 × 400; 111 KB
-
 Delaware population map.png 600 × 600; 136 KB
-
 Denver population Density by Race-Ethnicity, 2010.jpg 1,265 × 978; 624 KB
-
 Distribution of US Rural Population during 1910.pdf 2,468 × 1,652; 64.73 MB
-
 ES-Texas Population Density.png 624 × 475; 93 KB
-
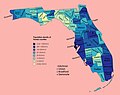
 Florida population map.png 600 × 600; 165 KB
-
 FloridaCountiesPopulation.png 910 × 808; 16 KB
-
 Frederick E. Pierce, The Tenement House Committee Maps 1895 Cornell CUL PJM 1121 02.jpg 8,935 × 6,474; 8.82 MB
-
 Geographical Distribution Japanese Population USA 1940 1.jpg 4,248 × 2,522; 2 MB
-
 Georgia population map.png 600 × 600; 255 KB
-
 Hawaii population map.png 600 × 600; 52 KB
-
 Hungarian1346.gif 500 × 375; 15 KB
-
 Idaho population map.png 600 × 600; 99 KB
-
 Illinois 2020 Population Density.png 2,116 × 2,796; 941 KB
-
 Illinois population map.png 600 × 600; 145 KB
-
 Indiana population map.png 600 × 600; 155 KB
-
 Iowa 2020 Population Density.png 2,980 × 1,954; 679 KB
-
 Iowa population map.png 700 × 400; 106 KB
-
 Jefferson county population density.gif 575 × 425; 44 KB
-
 Kansas population map.png 700 × 400; 83 KB
-
 Kentucky population map.png 700 × 400; 169 KB
-
 LACountyPopDensity.png 1,429 × 1,348; 501 KB
-
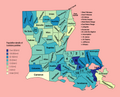
 Louisiana population map.png 600 × 600; 219 KB
-
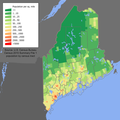 Maine population map.png 600 × 600; 158 KB
-
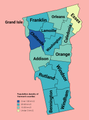
 Maps of Vermont population.png 510 × 500; 22 KB
-
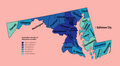
 Maryland population map.png 700 × 400; 180 KB
-
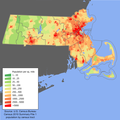 Massachusetts population map.png 600 × 600; 170 KB
-
 Michigan population map.png 600 × 600; 189 KB
-
 Michigan-2020-population-density.png 2,659 × 3,082; 1.08 MB
-
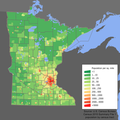
 Minnesota 2020 Population Density.png 2,768 × 2,486; 909 KB
-
 Minnesota population map cropped.png 806 × 882; 28 KB
-
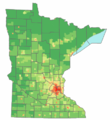
 Minnesota population map.png 600 × 600; 163 KB
-
 Mississippi population map 2.png 560 × 610; 53 KB
-
 Mississippi population map.png 600 × 600; 185 KB
-
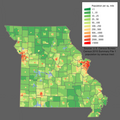 Missouri population map.png 600 × 600; 166 KB
-
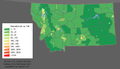 Montana population map.png 700 × 400; 100 KB
-
 Nebraska population map.png 700 × 400; 73 KB
-
 Nevada population map.png 600 × 600; 81 KB
-
 New 2000 asian density.gif 2,604 × 2,012; 550 KB
-
 New 2000 black density.gif 2,604 × 2,012; 620 KB
-
 New 2000 hispanic density.gif 2,604 × 2,012; 619 KB
-
 New Hampshire population map.png 600 × 600; 118 KB
-
 New Jersey Population Map.png 600 × 600; 187 KB
-
 New Mexico population map.png 600 × 600; 88 KB
-
 New York Population Map.png 600 × 600; 181 KB
-
 New York State municipalities population density.png 5,000 × 3,814; 2.59 MB
-
 Nj pop dens.png 1,709 × 1,671; 129 KB
-
 North Carolina population map.png 700 × 400; 171 KB
-
 North Dakota population map.png 700 × 400; 72 KB
-
 North-Carolina-Population-Density-2008.png 1,280 × 485; 216 KB
-
 Ohio population map.png 600 × 600; 172 KB
-
 Oklahoma population map.png 700 × 400; 123 KB
-
 Oregon population map 2000.png 700 × 400; 121 KB
-
 Pennsylvania population map 1.png 710 × 540; 41 KB
-
 Pennsylvania population map.png 700 × 400; 179 KB
-
 Population Density (5458009978).jpg 3,280 × 2,542; 1.41 MB
-
 Population density based on 1930 census. The Southern Appalachians - btv1b53197226z.jpg 9,510 × 8,050; 9.75 MB
-
 Population Density by Florida Census Tract - 2020 Census.png 4,000 × 4,000; 1.65 MB
-
 Population Density in the American Colonies 1775-ar.png 542 × 577; 194 KB
-
 Population Density in the American Colonies 1775.gif 752 × 800; 64 KB
-
 Population density of Alabama counties (2020).jpg 2,905 × 4,224; 793 KB
-
 Population density of Alaska boroughs and census areas (2020).png 5,666 × 3,846; 956 KB
-
 Population density of Arizona counties (2020).jpg 3,539 × 4,080; 389 KB
-
 Population density of Arkansas counties (2020).jpg 3,943 × 3,483; 896 KB
-
 Population density of California counties (2020).jpg 2,938 × 4,200; 571 KB
-
 Population density of Colorado counties (2020).jpg 4,624 × 3,218; 828 KB
-
 Population density of Connecticut counties (2020).jpg 4,293 × 3,972; 444 KB
-
 Population density of Delaware counties (2020).jpg 2,653 × 3,558; 218 KB
-
 Population density of Florida counties (2020).jpg 5,005 × 3,972; 782 KB
-
 Population density of Georgia counties (2020).jpg 3,706 × 3,637; 1.17 MB
-
 Population density of Hawaii counties (2020).jpg 4,288 × 2,631; 180 KB
-
 Population density of Idaho counties (2020).jpg 2,835 × 4,079; 496 KB
-
 Population Density of Illinois 2010 Wikipediamap.svg 547 × 590; 307 KB
-
 Population density of Illinois counties (2020).png 3,077 × 4,191; 1.44 MB
-
 Population density of Indiana counties (2020).png 3,170 × 4,098; 1.43 MB
-
 Population density of Iowa counties (2020).jpg 6,053 × 3,558; 1.18 MB
-
 Population density of Kansas counties (2020).png 5,885 × 3,092; 1.38 MB
-
 Population density of Kentucky counties (2020).png 4,433 × 2,445; 1.53 MB
-
 Population density of Louisiana parishes (2020).png 3,636 × 2,920; 1.1 MB
-
 Population density of Maine counties (2020).png 2,775 × 3,674; 688 KB
-
 Population density of Maryland counties (2020).png 4,074 × 2,235; 721 KB
-
 Population density of Massachusetts counties (2020).png 4,772 × 2,431; 688 KB
-
 Population density of Michigan counties (2020).png 3,953 × 3,944; 1.3 MB
-
 Population density of Minnesota counties (2020).png 3,739 × 4,024; 1.14 MB
-
 Population density of Mississippi counties (2020).png 3,036 × 4,196; 1.2 MB
-
 Population density of Missouri counties (2020).png 4,586 × 3,916; 1.53 MB
-
 Population density of Montana counties (2020).png 5,350 × 3,395; 1.18 MB
-
 Population density of Nebraska counties (2020).png 5,113 × 2,668; 1.04 MB
-
 Population density of Nevada counties (2020).png 3,221 × 4,163; 556 KB
-
 Population density of New Hampshire counties (2020).png 2,537 × 4,130; 568 KB
-
 Population density of New Jersey counties (2020).png 2,006 × 3,740; 616 KB
-
 Population density of New Mexico counties (2020).png 4,116 × 3,772; 791 KB
-
 Population density of New York counties (2020).png 4,949 × 3,940; 1.41 MB
-
 Population density of North Carolina counties (2020).png 5,201 × 2,626; 1.48 MB
-
 Population density of North Dakota counties (2020).png 5,061 × 2,933; 918 KB
-
 Population density of Ohio counties (2020).png 3,818 × 4,094; 1.59 MB
-
 Population density of Oklahoma counties (2020).png 5,429 × 2,971; 1.17 MB
-
 Population density of Oregon counties (2020).png 4,903 × 3,866; 1.06 MB
-
 Population density of Pennsylvania counties (2020).png 4,860 × 3,176; 1.41 MB
-
 Population density of Rhode Island counties (2020).png 4,525 × 2,780; 600 KB
-
 Population density of South Carolina counties (2020).png 5,560 × 4,145; 1.56 MB
-
 Population density of South Dakota counties (2020).png 4,814 × 3,311; 1.04 MB
-
 Population density of Tennessee counties (2020).png 5,839 × 2,128; 1.39 MB
-
 Population density of Texas counties (2020).jpg 4,758 × 4,266; 1.25 MB
-
 Population density of U.S. counties.png 6,518 × 4,061; 3.08 MB
-
 Population density of U.S. states and territories.png 5,285 × 3,762; 1.05 MB
-
 Population Density of United States.png 5,000 × 3,500; 1.22 MB
-
 Population density of Utah counties (2020).png 3,590 × 4,042; 801 KB
-
 Population density of Vermont counties (2020).png 2,873 × 3,870; 642 KB
-
 Population density of Virginia counties (2020).png 4,792 × 2,352; 2.77 MB
-
 Population density of Washington counties (2020).png 5,326 × 3,930; 1.44 MB
-
 Population density of West Virginia counties (2020).png 4,987 × 4,158; 1.4 MB
-
 Population density of Wisconsin counties (2020).png 4,125 × 4,210; 1.37 MB
-
 Population density of Wyoming counties (2020).png 5,066 × 3,730; 799 KB
-
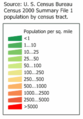 Population map key.png 190 × 273; 6 KB
-
 Population Scaled US Map.svg 407 × 345; 42 KB
-
 Public provision for recreation (1920) (14760804414).jpg 1,984 × 1,710; 491 KB
-
 Puerto Rico Population Density, 2000 (5457017793).jpg 2,505 × 3,194; 546 KB
-
 Puerto Rico Population Density, 2000 (6171916519).jpg 2,342 × 3,161; 527 KB
-
-
 Rhode Island population map (magyar).png 620 × 450; 30 KB
-
 Rhode Island population map.png 600 × 600; 124 KB
-
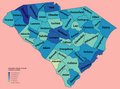
 South Carolina population map.png 600 × 600; 198 KB
-
 South Dakota population map.png 700 × 400; 77 KB
-
 South Dakota.png 395 × 252; 6 KB
-
 Summary File 1, 2010 Population Density (34337604624).jpg 3,095 × 2,445; 1,002 KB
-
 Tennessee population map.png 700 × 400; 152 KB
-
 Texas population map.png 600 × 600; 174 KB
-
 Texas population map2.png 624 × 475; 35 KB
-
 The Cleveland medical journal (1913) (14774515744).jpg 2,048 × 1,592; 358 KB
-
 The Tenement-House Committee maps LOC 2006629793.jpg 6,371 × 4,572; 3.84 MB
-
 The Tenement-House Committee maps LOC 2006629793.tif 6,371 × 4,572; 83.34 MB
-
 U.S. states and territories by population density.svg 959 × 593; 54 KB
-
 United States of America Population Density, 2000 (5457020109).jpg 2,491 × 3,219; 1,004 KB
-
 United States of America Population Density, 2000 (6171922067).jpg 2,324 × 3,161; 1.06 MB
-
 United States population density (HY).png 4,074 × 2,870; 948 KB
-
 United States Population Density.svg 648 × 468; 1.82 MB
-
 United States population distribution 2000 census.png 1,069 × 880; 64 KB
-
 United States Virgin Islands Population Density, 2000 (6172452398).jpg 2,385 × 3,161; 552 KB
-

-
 US 2000 census population density map by state.svg 936 × 581; 3.39 MB
-
 US Census 1990 black.jpg 1,280 × 997; 1.18 MB
-
 US counties by population density.png 1,513 × 983; 199 KB
-
 US population map.png 992 × 793; 454 KB
-
 US Rural Population during 1910 - West, retouched.png 1,820 × 2,511; 6.18 MB
-
 USA 2000 asian density.jpg 762 × 495; 75 KB
-
 USA 2000 Black Density.PNG 762 × 494; 685 KB
-
 USA 2000 black density.png 1,130 × 716; 135 KB
-
 USA 2000 population density.jpg 760 × 498; 70 KB
-
 USA 2000 population density.png 860 × 545; 38 KB
-
 USA states population density map.PNG 936 × 581; 36 KB
-
 USA-2000-black-density.gif 901 × 590; 53 KB
-
 USA-2000-population-density.gif 907 × 592; 57 KB
-
 USstates pop density uk.png 936 × 581; 20 KB
-
 Utah population map.png 600 × 600; 78 KB
-
 Utah Valley dasymetric map.png 3,167 × 1,569; 1.46 MB
-
 Vermont population map.png 600 × 600; 110 KB
-
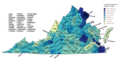
 Virginia population map.png 700 × 400; 186 KB
-
 Virginia-Density.svg 792 × 344; 403 KB
-
 VS inwoners pmi2 zonder rangorde is fout leeskaart.PNG 997 × 616; 48 KB
-
 Vs stippenkaart.PNG 1,582 × 981; 161 KB
-
 Washington population map.png 700 × 400; 142 KB
-
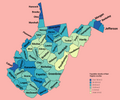
 West Virginia population map.png 700 × 400; 107 KB
-
 WestTexasPopulationDensity2000.JPG 310 × 230; 18 KB
-
 Wisconsin 2020 Population Density.png 2,690 × 2,485; 940 KB
-
 Wisconsin population map 2.png 720 × 570; 35 KB
-
 Wisconsin Population map.jpg 1,271 × 1,275; 136 KB
-
 Wisconsin population map.png 600 × 600; 168 KB
-
 Wyoming population map.png 700 × 400; 73 KB


_(NYPL_b20643888-5571362).jpg)


.jpg)


.jpg)
.png)
.jpg)
.jpg)
.jpg)
.jpg)
.jpg)
.jpg)
.jpg)
.jpg)
.jpg)
.jpg)

.png)
.png)
.jpg)
.png)
.png)
.png)
.png)
.png)
.png)
.png)
.png)
.png)
.png)
.png)
.png)
.png)
.png)
.png)
.png)
.png)
.png)
.png)
.png)
.png)
.png)
.png)
.png)
.png)
.png)
.jpg)


.png)
.png)
.png)
.png)
.png)
.png)
.png)


_(14760804414).jpg)
.jpg)
.jpg)
_(14758504564).jpg)
.png)


.jpg)


_(14774515744).jpg)


.jpg)
.jpg)
.png)


.jpg)
.jpg)


.png)