Category:Phylogenetic tree of human populations
Jump to navigation
Jump to search
English: This category primarily focuses on the tree diagrams which treat relatedness of variants within anatomically modern human (Homo sapiens sapiens). For the diagrams which include human as branches in trees, see Category:Phylogenetic trees of humans.
日本語: このカテゴリは主に現世人類(ホモ・サピエンス・サピエンス)内部の近縁関係を扱ったツリー図を対象としています。現生人類を一部の枝として含むようなツリー図については Category:Phylogenetic trees of humans をご覧ください。
Subcategories
This category has the following 3 subcategories, out of 3 total.
O
Media in category "Phylogenetic tree of human populations"
The following 66 files are in this category, out of 66 total.
-
9 Cluster Tree small.png 377 × 216; 12 KB
-
9 Cluster Tree.png 1,180 × 1,150; 53 KB
-
A Short History of the World, p0089.jpg 1,378 × 962; 251 KB
-
Antepassatshome6.jpg 450 × 370; 20 KB
-
Cladogram.png 569 × 1,000; 44 KB
-
Clustering of individuals with Irish and British ancestry based solely on genetics.jpg 1,500 × 1,387; 190 KB
-
Clustering of PASNP population groups by selection signals.jpg 546 × 568; 75 KB
-
Clustering of the PASNP and HapMap populations.jpg 1,227 × 1,247; 314 KB
-
Cohanim haplotype tree.jpg 538 × 600; 138 KB
-
Comprehensive description of population structure across Britain and Ireland.png 846 × 1,280; 618 KB
-
Consensus Neighbor-Joining Tree of Populations.png 4,180 × 3,350; 85 KB
-
Dendrogram of the genetic distances between Russian populations.svg 570 × 394; 33 KB
-
Estimates of shared ancestry between Spanish individuals.png 1,999 × 2,443; 3.04 MB
-
Fine-grained population structure in Ireland.png 4,460 × 4,176; 1.91 MB
-
Genes mirror geography in the British Isles.PNG 4,468 × 3,711; 1.13 MB
-
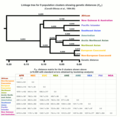
Genetic distance.PNG 530 × 431; 19 KB
-
Genetic tree of 39 Asian populations.png 587 × 808; 89 KB
-
Hierarchical population tree of sub-Saharan African populations.png 1,775 × 887; 750 KB
-
High resolution of human evolutionary trees.jpg 490 × 400; 52 KB
-
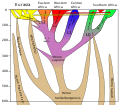
Homo sapiens lineage (350ka).svg 722 × 400; 38 KB
-
Homo sapiens lineage.svg 722 × 632; 38 KB
-
Human History AR.svg 800 × 480; 1.28 MB
-
Human race genetic map Y chromosome.png 690 × 410; 15 KB
-
Human-phylo-tree.JPG 1,229 × 245; 29 KB
-
Human-phylo-tree.png 1,229 × 245; 19 KB
-
Human-phylo-tree.svg 3,019 × 532; 11 KB
-
Journal.pgen.0030185.g008.png 546 × 600; 81 KB
-
Maximum likelihood tree of 17 populations including Mlabri.png 1,200 × 1,346; 319 KB
-
Maximum parsimony cladogram of mtDNA and Y-chromosome SNPs.jpg 414 × 767; 109 KB
-
Maximum-Likelihood tree of samples from Denmark and Greenland.svg 313 × 322; 61 KB
-
Neigbour-joining-tree-of-population-genetic-gr.png 581 × 624; 19 KB
-
Neigbour-joining-tree-of-population-genetic.png 581 × 624; 12 KB
-
Neighbor-joining tree of Jewish people and others.png 520 × 504; 64 KB
-
Neighbor-Joining tree of Mlabri and others based on allele sharing distance.png 1,200 × 1,325; 232 KB
-
Neighbor-joining tree of Northern Eurasian populations.png 1,917 × 2,371; 136 KB
-
Neighbor-joining tree.jpg 1,000 × 670; 226 KB
-
Neighbor-joining Tree.svg 725 × 459; 93 KB
-
NJ tree of Tianjiao1 (DU Mongolian) and other 54 unrelated individuals.png 1,798 × 1,779; 212 KB
-
PCA and genetic distances of Uralic-speaking populations.png 1,957 × 2,478; 1.49 MB
-
Phylogenetic tree and PCA of East Asian populations.png 553 × 828; 127 KB
-
Phylogenetic tree of Asian people.jpg 926 × 861; 175 KB
-
Phylogeny and geographical distribution of European MSY lineages.jpg 946 × 451; 86 KB
-
Plos Balkans.png 1,086 × 319; 61 KB
-
Population relationships from genome-wide haplotypes.png 4,760 × 2,608; 1.22 MB
-
Populations.png 628 × 932; 158 KB
-
QpGraph for ancient Eurasians.jpg 902 × 1,506; 114 KB
-
Spanish individuals grouped into clusters using genetic data only.png 1,924 × 2,548; 1.47 MB
-
T-SNE of Irish and British coancestry matrix.PNG 4,466 × 3,574; 1.1 MB
-
Time of divergence between the Kalash and other populations.png 500 × 587; 87 KB
-
TreeMix analysis of Kalash and other populations.png 1,078 × 663; 138 KB
-
TreeMix analysis of Parsi and other Eurasian populations.png 2,918 × 1,859; 67 KB
-
TreeMix hierarchical clustering analysis of Qatari.png 652 × 488; 85 KB
-
Treemix tree of Orang Asli subgroups, Negrito groups of Andaman Islands.jpg 758 × 1,280; 79 KB
-
Ust′-Ishim in the tree.jpg 946 × 310; 52 KB
-
West Eurasian phylogenetic structure projected on a map.png 3,804 × 2,592; 18.28 MB
-
World map of prehistoric human migrations.jpg 889 × 635; 274 KB
-
World Map of Y-DNA Haplogroups.png 3,000 × 1,900; 1.46 MB
-
遺伝学のインド競争.png 332 × 272; 6 KB
-
遺伝的近縁図.png 726 × 461; 66 KB
-
遺伝系統樹.jpg 1,739 × 1,411; 284 KB

