Category:Photovoltaic power statistics of Germany
Jump to navigation
Jump to search
Media in category "Photovoltaic power statistics of Germany"
The following 35 files are in this category, out of 35 total.
-
 German Photovoltaics Installed Capacity.svg 800 × 600; 11 KB
-
 German Wind and Solar Generation Histogram-Equal Annual.svg 800 × 600; 7 KB
-
 German Wind and Solar Generation Histogram-Equal Max Daily.svg 800 × 600; 7 KB
-
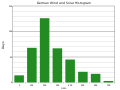 German Wind and Solar Generation Histogram.svg 800 × 600; 7 KB
-
 German Wind and Solar semilog.png 990 × 360; 33 KB
-
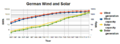
 German wind and solar-semilog.svg 800 × 600; 30 KB
-
 Germany Renewable Energy 2016-05-07 to 09.svg 750 × 560; 20 KB
-
 Germany Wind And Solar 2016-05-07 to 09.svg 750 × 560; 17 KB
-
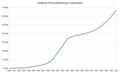
 Germany Wind and Solar Generation Percentage-semilog.svg 800 × 600; 25 KB
-
 Germany-PV-SystemPrice.png 552 × 498; 19 KB
-
 GET en 2A11 price of solar down in Germany since 2006.png 1,001 × 769; 58 KB
-
 Histogramm der PV-Anlagen Deutschland Jan2009-Mai2010.jpg 560 × 420; 18 KB
-
 Installierte Photovoltaik-Nennleistung Deutschland und weltweit.png 1,504 × 651; 39 KB
-
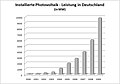
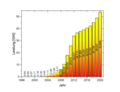
 Installierte Photovoltaikleistung in Deutschland.png 1,786 × 1,090; 85 KB
-
 Last Solareinspeisung Deutschland.png 600 × 300; 6 KB
-
 Photovoltaik Deutschland (2010).jpg 666 × 466; 56 KB
-
 Photovoltaik Deutschland.png 599 × 308; 9 KB
-
 Photovoltaikleistung Deutschland 1997 bis 2020.png 1,072 × 820; 29 KB
-
 PV-Ertrag Nordbayern (Karlstadt) 2018 Monatsdarstellung.jpg 2,999 × 3,624; 3.33 MB
-
 PV-Ertrag Nordbayern (Karlstadt) 2019 Monatsdarstellung.jpg 946 × 462; 87 KB
-
 PV-Ertrag Nordbayern (Karlstadt) 2020 Monatsdarstellung.jpg 922 × 538; 90 KB
-
 PV-Ertrag Nordbayern (Karlstadt) 2021 Monatsdarstellung.png 877 × 458; 52 KB
-
 PV-Ertrag Nordbayern (Karlstadt) 2022 Monatsdarstellung.png 903 × 542; 59 KB
-
 PV-Ertrag Nordbayern (Karlstadt) 2023 Monatsdarstellung.png 1,472 × 881; 174 KB
-
 PV-Norddeutschland-2008-Monatsdarstellung.svg 956 × 726; 96 KB
-
 PV-Norddeutschland-2008-Tagesdarstellung.svg 956 × 726; 211 KB
-
 Solar und Windeinspeisung DE mit Restlast (rot).png 600 × 300; 8 KB
-
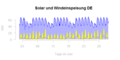 Solar und Windeinspeisung DE.png 600 × 300; 6 KB
-
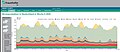
 Stromerzeugung in D Woche 1 2024.png 1,328 × 851; 238 KB
-
 Stromerzeugung in D Woche 12 2024.png 1,321 × 850; 256 KB
-
 Stromerzeugung in D Woche 25 2024.png 1,335 × 862; 280 KB
-
 Stromproduktion Deutschland 2020 W 08 Ertrag in Zahlen.jpg 434 × 316; 75 KB
-
 Stromproduktion Deutschland 2020 W 08 Ertrag.jpg 1,936 × 893; 198 KB
-
 Stromproduktion Deutschland 2020 W 08 Zahlen.jpg 651 × 409; 125 KB
-
 Stromproduktion Deutschland 2020 W 08.jpg 1,869 × 806; 214 KB


.jpg)


_2018_Monatsdarstellung.jpg)
_2019_Monatsdarstellung.jpg)
_2020_Monatsdarstellung.jpg)
_2021_Monatsdarstellung.png)
_2022_Monatsdarstellung.png)
_2023_Monatsdarstellung.png)


.png)


