Category:Personal income taxes in the United States
Jump to navigation
Jump to search
Countries of the Americas: Brazil · United States of America
Subcategories
This category has the following 2 subcategories, out of 2 total.
Media in category "Personal income taxes in the United States"
The following 61 files are in this category, out of 61 total.
-

-
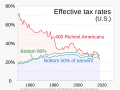 1960- Tax rates of richest versus low income people - US.svg 1,000 × 750; 6 KB
-
 2009-07-05 Liberty Tax Service in Durham.jpg 3,888 × 2,592; 3.14 MB
-
 Annual growth in family income vs tax rate.png 1,024 × 768; 42 KB
-

-
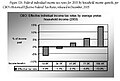
 CBO Median Income Tax Rates.jpg 671 × 273; 55 KB
-
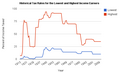 Chart 1.png 545 × 332; 18 KB
-
 Congressional Budget Office report 2019-01-24 - Marginal Federal Tax Rates on Labor Income - 1962 to 2028.pdf 1,650 × 1,275, 47 pages; 1.43 MB
-
 Distribution of U.S. Federal Taxes 2000.JPG 539 × 330; 33 KB
-
 Earned IncomeTaxCreditWithOneQualifyingChild.PNG 1,200 × 900; 174 KB
-

-
 Effective tax rate in the US by top tax rate.svg 800 × 600; 11 KB
-

-
 Employment growth by top tax rate.svg 800 × 600; 13 KB
-
 Federal Income Tax Rates in the US, 2009.jpg 665 × 430; 46 KB
-
 Federal individual income tax receipts 2000-2009.png 960 × 720; 23 KB
-
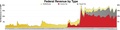 Federal taxes by type.pdf 2,760 × 689; 593 KB
-
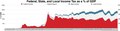 Federal, State, and Local income tax GDP.pdf 2,679 × 683; 319 KB
-

-
 Fiestas Patrias Parade, South Park, Seattle, 2017 - 231 - Liberty Tax.jpg 4,288 × 2,848; 6.54 MB
-
-
 GDP per capita growth rate and the top marginal tax rates, 1945-2010.jpg 1,057 × 685; 81 KB
-
 Growth in US tax revenue by top tax rate.svg 800 × 600; 13 KB
-
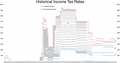
 Historical Income Tax Rates and brackets.png 12,870 × 6,753; 986 KB
-
 Historical income tax rates marginal rates.webp 12,870 × 2,657; 868 KB
-
 Historical income tax rates.webp 12,941 × 2,713; 872 KB
-
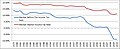
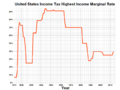
 Historical Marginal Tax Rate for Highest and Lowest Income Earners.jpg 4,458 × 1,973; 1.3 MB
-
 Income after taxes and welfare.webp 1,317 × 580; 72 KB
-
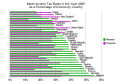 Income Taxes By Country 2005.svg 810 × 570; 379 KB
-
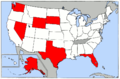 Map of USA highlighting states with no income tax on wages.PNG 904 × 593; 28 KB
-
 Map of USA highlighting states with no income tax on wages.svg 959 × 593; 78 KB
-
 MarginalIncomeTax.svg 585 × 360; 39 KB
-
 Median family income growth by top tax rate.svg 800 × 600; 13 KB
-
 Median personal income after taxes.webp 5,300 × 2,533; 149 KB
-
 North Star Freedom Logo.svg 1,098 × 1,314; 5 KB
-
 Obama McCain taxes.gif 457 × 360; 16 KB
-
 Obama-mccain tax-plans 1.svg 248 × 344; 42 KB
-
 Piketty 14.1 top marginal income tax rate.png 630 × 354; 44 KB
-
 Revenue and Expense to GDP Chart 1993 - 2007.png 960 × 720; 9 KB
-
 SaturdayEveningPost2Jan1926.jpg 575 × 800; 106 KB
-
 Share of taxes vs. AGI.svg 504 × 504; 15 KB
-
 State and Local Income Tax in the United States.png 1,086 × 1,020; 81 KB
-
 Taxes debt.png 1,013 × 647; 97 KB
-
 Top five percent income growth by top tax rate.svg 800 × 600; 13 KB
-
 Top Marginal State Income Tax Rate.svg 959 × 593; 817 KB
-
 Top one hundreth of one percent income growth by top tax rate.svg 800 × 600; 13 KB
-
 Top one percent income growth by top tax rate.svg 800 × 600; 13 KB
-
 Top ten percent income growth by top tax rate.svg 800 × 600; 13 KB
-
 Total State Government Tax Revenue By Type.png 1,623 × 968; 200 KB
-
 U.S. Federal Income Tax Rates 2013.png 960 × 720; 54 KB
-
 U.S. Federal Income Tax Rates.png 1,724 × 1,149; 101 KB
-
 US GDP Growth vs Personal Income Tax Rate.svg 800 × 600; 15 KB
-
 US GDP per capita growth by top tax rate.svg 800 × 600; 14 KB
-
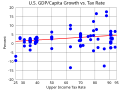 US GDP per Capita Growth vs Personal Income Tax Rate.svg 800 × 600; 15 KB
-
 US Income Tax Rate.png 1,024 × 768; 31 KB
-
 US middle income tax burden.png 1,024 × 768; 27 KB
-
 US million dollar income tax burden.png 1,024 × 768; 29 KB
-
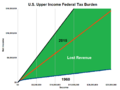 US upper income tax burden.png 1,024 × 768; 26 KB
-

-
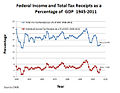 USTaxRevenue1945-2011.jpeg 641 × 496; 66 KB
-


.gif)


