Category:Pandemic statistics
Jump to navigation
Jump to search
Subcategories
This category has the following 3 subcategories, out of 3 total.
Media in category "Pandemic statistics"
The following 35 files are in this category, out of 35 total.
-
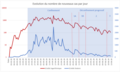
 2009 vs 2020 pandemic comparison.png 862 × 522; 25 KB
-
 Background.svg 649 × 602; 83 KB
-
 Casos y muertes del virus del ébola 1976-2003.jpg 220 × 156; 6 KB
-
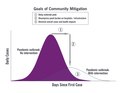
 Community mitigation (cropped).jpg 3,149 × 1,775; 146 KB
-
 Community mitigation vector.svg 1,001 × 531; 20 KB
-
 Community mitigation.pdf 1,650 × 1,275; 245 KB
-
 COVID-19 health system capacity increase.svg 558 × 331; 5 KB
-
 COVID-19 health system overload.svg 558 × 331; 6 KB
-
 Covid-19-curves-graphic-social-v3-pt.gif 1,076 × 678; 728 KB
-
 Covid-19-curves-graphic-social-v3-smn.gif 1,360 × 856; 725 KB
-
 Distribution des cas confirmés covid-19 par province en Belgique.jpg 1,189 × 638; 105 KB
-
 Ebola v2.png 846 × 464; 11 KB
-
 Ebola.png 846 × 464; 9 KB
-
 Ebola3.png 857 × 511; 11 KB
-
 Ebola4.png 821 × 460; 10 KB
-
 Excessive mortality in Europe 2020-2021.gif 700 × 700; 1.9 MB
-
 Flatten the Curve.png 1,640 × 474; 39 KB
-

-
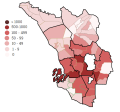
 Malaysia covid 19 active cases by district 25 april.png 1,920 × 731; 136 KB
-
 Modified death rate during pandemic.gif 1,674 × 441; 67 KB
-
 Pan Flu.JPG 571 × 307; 47 KB
-
 Pandemic Severity Index 1.jpg 516 × 484; 30 KB
-
 Pandemic Severity Index 2.jpg 635 × 390; 40 KB
-
 Pandemic.png 1,195 × 452; 221 KB
-

-
 Progression nouveaux cas - Belgique - échelle linéaire et logarithmique.tif 1,104 × 660; 2.89 MB
-
 Spanish flu death chart.png 992 × 756; 844 KB
-
 Temps de doublement.tif 1,119 × 637; 2.83 MB
-
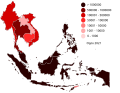 The Pandemic COVID-19 cumulative cases in Southeast Asia.svg 492 × 378; 148 KB
-
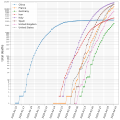 Top 8 countries deaths caused by coronavirus.svg 1,350 × 1,350; 167 KB
-
 W curve.png 600 × 424; 20 KB
-

-

-
-


.jpg)


