Category:Our World in Data graphics about taxes and public spending
Jump to navigation
Jump to search
Subcategories
This category has only the following subcategory.
*
Media in category "Our World in Data graphics about taxes and public spending"
The following 91 files are in this category, out of 91 total.
-

-

-

-
 Child mortality vs per capita total health expenditure, OWID.svg 850 × 600; 36 KB
-
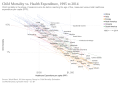 Child Mortality vs. Health Expenditure (Gapminder), OWID.svg 850 × 600; 101 KB
-
 Child mortality vs. health expenditure, OWID.svg 850 × 600; 40 KB
-
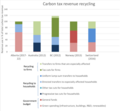 Climate-tax-revenue.png 854 × 789; 99 KB
-
 Composition of tax revenues, OWID.svg 850 × 600; 7 KB
-
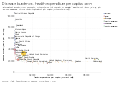 Disease burden vs. health expenditure per capita, OWID.svg 850 × 600; 34 KB
-

-
 Expenditures on general government outsourcing (%GDP), OWID.svg 850 × 600; 11 KB
-

-
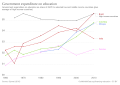 Government expenditure on education, OWID.svg 850 × 600; 9 KB
-
 Government expenditure on primary education by country, OWID.svg 850 × 600; 13 KB
-

-

-

-
-
 Government Revenues as a share of national income, OWID.svg 850 × 600; 7 KB
-
 Health expenditure and financing, per capita, OWID.svg 850 × 600; 19 KB
-

-
 Healthcare Expenditure vs. GDP, OWID.svg 850 × 600; 34 KB
-
 Healthcare expenditure, OWID.svg 850 × 600; 10 KB
-
 Healthcare-expenditure-vs-gdp.png 3,400 × 2,400; 648 KB
-
 Healthy life expectancy vs. Health expenditure per capita, OWID.svg 850 × 600; 34 KB
-
 Historical-gov-spending-gdp.svg 850 × 600; 49 KB
-
-
 Life expectancy vs. health expenditure per capita, OWID.svg 850 × 600; 36 KB
-
 Life expectancy vs. health expenditure, OWID.svg 850 × 600; 40 KB
-
 Life expectancy vs. healthcare expenditure, OWID.svg 850 × 600; 40 KB
-
 Maternal mortality vs. health expenditure over time, OWID.svg 850 × 600; 35 KB
-

-

-
 Median monthly per capita expenditure vs. GDP per capita, OWID.svg 850 × 600; 11 KB
-
 Military expenditure (% of GDP), OWID.svg 850 × 600; 26 KB
-
 Military expenditure as a share of GDP, OWID.svg 850 × 600; 9 KB
-
 Military expenditure as share of GDP, OWID.svg 850 × 600; 14 KB
-

-
 Military expenditure by country, OWID.svg 850 × 600; 15 KB
-
 Military expenditure per capita, constant 2015 US$, OWID.svg 850 × 600; 22 KB
-
 Military expenditure per capita, OWID.svg 850 × 600; 23 KB
-

-

-

-
 Out-of-pocket expenditure per capita on healthcare, OWID.svg 850 × 600; 15 KB
-
 Procurement expenditure (% GDP) vs GDP per capita, OWID.svg 850 × 600; 14 KB
-
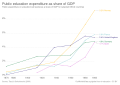 Public education expenditure as share of GDP, OWID.svg 850 × 600; 8 KB
-

-

-
 Public health expenditure (% GDP), OWID.svg 850 × 600; 14 KB
-
 Public healthcare expenditure as share of GDP, OWID.svg 850 × 600; 12 KB
-

-

-
 Share of education in government expenditure, OWID.svg 850 × 600; 10 KB
-

-
 Share of Out-of-Pocket Expenditure vs. GDP per capita, OWID.svg 850 × 600; 35 KB
-
 Share of social protection in government expenditure, OWID.svg 850 × 600; 13 KB
-

-

-

-
 Share-of-out-of-pocket-expenditure-on-healthcare.png 3,400 × 2,400; 365 KB
-
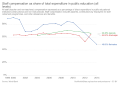
 Share-of-public-expenditure-on-healthcare-by-country.png 3,400 × 2,400; 318 KB
-
 Social expenditure as share of GDP, OWID.svg 850 × 600; 12 KB
-
-
 Statutory corporate income tax rate, OWID.svg 850 × 600; 14 KB
-
 Statutory corporate income tax rates, 2000 vs 2018, OWID.svg 850 × 600; 23 KB
-
 Tariff rate across all products, OWID.svg 850 × 600; 8 KB
-
 Tariff rate for primary and manufactured products, OWID.svg 850 × 600; 23 KB
-
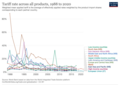 Tariff-rate-applied-weighted-mean-all-products.png 3,400 × 2,400; 832 KB
-
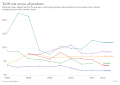
 Tariff-rates.png 3,400 × 2,400; 525 KB
-
 Tax reduction in income inequality (%), OWID.svg 850 × 600; 12 KB
-

-
 Tax revenue, OWID.svg 850 × 600; 23 KB
-
 Tax revenues by source, OWID.svg 850 × 600; 19 KB
-
 Taxes on goods and services, OWID.svg 850 × 600; 15 KB
-
 Taxes on income vs. taxes on goods and services, OWID.svg 850 × 600; 29 KB
-
 Taxes on incomes of individuals and corporations, OWID.svg 850 × 600; 16 KB
-
 Top marginal income tax rate, OWID.svg 850 × 600; 48 KB
-

-
 Top marginal income tax rates, selected countries, OWID.svg 850 × 600; 28 KB
-
 Total government expenditure on education (% GDP), OWID.svg 850 × 600; 40 KB
-
 Total government expenditure on education, OWID.svg 850 × 600; 14 KB
-
 Total government expenditure per capita (USD PPP), OWID.svg 850 × 600; 9 KB
-
 Total tax revenues, OWID.svg 850 × 600; 17 KB
-
 Two measures of government expenditure as a share of GDP, OWID.svg 850 × 600; 29 KB
-
 US education expenditure as share of GDP, OWID.svg 850 × 600; 8 KB
-
 US Healthcare Expenditure, OWID.svg 850 × 600; 7 KB
-
 Various measures of health expenditure as share of GDP, OWID.svg 850 × 600; 17 KB
-
 Various measures of social expenditure as share of GDP, OWID.svg 850 × 600; 12 KB
-
 World Health Expenditure as Share of Global GDP, OWID.svg 850 × 600; 6 KB
-

_vs._R%26D_expenditure_(%25_of_GDP),_OWID.svg)


,_OWID.svg)


_in_the_UK,_OWID.svg)
,_OWID.svg)


,_OWID.svg)


,_OWID.svg)


,_OWID.svg)


,_OWID.svg)


_vs_GDP_per_capita,_OWID.svg)


,_OWID.svg)


,_OWID.svg)


,_OWID.svg)


,_OWID.svg)

,_OWID.svg)

,_OWID.svg)


