Category:Our World in Data graphics about stunted growth
Jump to navigation
Jump to search
Subcategories
This category has only the following subcategory.
Media in category "Our World in Data graphics about stunted growth"
The following 13 files are in this category, out of 13 total.
-
 Child mortality vs. Prevalence of stunting, OWID.svg 850 × 600; 25 KB
-

-
 Prevalence of childhood stunting, male vs. female, OWID.svg 850 × 600; 10 KB
-
 Prevalence of stunting vs. improved sanitation facilities, OWID.svg 850 × 600; 14 KB
-

-

-
 Prevalence-of-stunting-vs-improved-sanitation-facilities (1).png 3,400 × 2,400; 571 KB
-
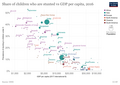
 Share of children who are stunted vs GDP per capita, OWID.svg 850 × 600; 36 KB
-

-
 Stunting by World Bank income group, OWID.svg 850 × 600; 5 KB
-
 Stunting vs level of prosperity, 1, OWID.svg 850 × 600; 22 KB
-
 Stunting vs level of prosperity, OWID.svg 850 × 600; 24 KB
-
 Stunting-vs-level-of-prosperity-over-time-ihme.png 3,400 × 2,400; 683 KB


.png)

.png)


