Category:Our World in Data food and agriculture maps of the world
Jump to navigation
Jump to search
Subcategories
This category has only the following subcategory.
O
Media in category "Our World in Data food and agriculture maps of the world"
The following 200 files are in this category, out of 209 total.
(previous page) (next page)-
 Agricultural water as a share of total water withdrawals, OWID.svg 850 × 600; 140 KB
-
 Agricultural water withdrawals, OWID.svg 850 × 600; 141 KB
-
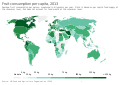
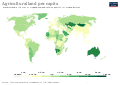 Agricultural-area-per-capita (1).svg 850 × 600; 169 KB
-
 Agricultural-land (OWID 0024).png 850 × 600; 97 KB
-
 Agricultural-land-irrigation (OWID 0023).png 850 × 600; 107 KB
-
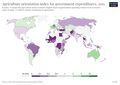
 Agriculture orientation index for government expenditures, OWID.svg 850 × 600; 140 KB
-
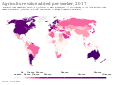 Agriculture value added per worker, OWID.svg 850 × 600; 141 KB
-
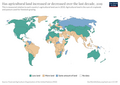 Agriculture-more-less-land (OWID 0019).png 850 × 600; 103 KB
-
 Agriculture-orientation-index (OWID 0018).png 850 × 600; 102 KB
-
 Agriculture-orientation-index.png 3,400 × 2,400; 831 KB
-
 Agriculture-share-gdp (OWID 0017).png 850 × 600; 99 KB
-
 Agriculture-value-added-per-worker-wdi.png 3,400 × 2,400; 885 KB
-
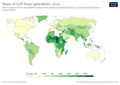
 Annual CO2 emissions from deforestation, global.png 1,746 × 1,234; 360 KB
-
 Antibiotic use in livestock, OWID.svg 850 × 600; 141 KB
-
 Apple production by country 2022.png 3,400 × 2,400; 796 KB
-
 Area-meadows-and-pastures (OWID 0087).png 850 × 600; 107 KB
-
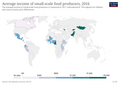
 Average income of small-scale food producers, OWID.svg 850 × 600; 139 KB
-
 Average Income of small-scale food producers.png 3,400 × 2,400; 726 KB
-

-

-
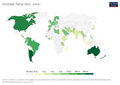 Average-farm-size (OWID 0085).png 850 × 600; 93 KB
-
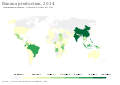
 Banana production by country 2022.png 3,400 × 2,400; 786 KB
-
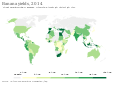
 Banana production, OWID.svg 850 × 600; 140 KB
-
 Banana yields, OWID.svg 850 × 600; 140 KB
-
 Barley-production.png 3,400 × 2,400; 793 KB
-
 Bean production, world map, OWID.svg 850 × 600; 154 KB
-
 Beef meat production, OWID.svg 850 × 600; 141 KB
-
 Beef-and-buffalo-meat-production-tonnes (OWID 0080).png 850 × 600; 105 KB
-
 Beer as a share of total alcohol consumption, OWID.svg 850 × 600; 139 KB
-
 Beer consumption per person, OWID.svg 850 × 600; 141 KB
-
 Beer-as-share-alcohol-consumption.png 3,400 × 2,400; 752 KB
-
 Bottom-trawling (OWID 0138).png 850 × 600; 104 KB
-
 Budget-to-manage-invasive-alien-species (OWID 0135).png 850 × 600; 101 KB
-
 Cashew nut yields, OWID.svg 850 × 600; 147 KB
-
 Cattle meat per animal, OWID.svg 850 × 600; 140 KB
-
 Cattle-livestock-count-heads (OWID 0116).png 850 × 600; 95 KB
-
 Cattle-livestock-count-heads.png 3,400 × 2,400; 811 KB
-
 Cattle-meat-yields-hectograms-100-grams-per-animal (OWID 0115).png 850 × 600; 93 KB
-
 Cereal yield, OWID.svg 850 × 600; 140 KB
-
 Cereal-production (OWID 0111).png 850 × 600; 103 KB
-
 Change-calories-climate-yield (OWID 0166).png 850 × 600; 107 KB
-
 Chicken meat production, OWID.svg 850 × 600; 140 KB
-
 Chicken meat yields per animal, OWID.svg 850 × 600; 139 KB
-
 Cocoa bean production, OWID.svg 850 × 600; 139 KB
-
 Cocoa bean yields, OWID.svg 850 × 600; 142 KB
-
 Coefficient of Variation (CV) in per capita caloric intake, OWID.svg 850 × 600; 143 KB
-
 Coffee bean production, OWID.svg 850 × 600; 140 KB
-
 Coffee bean yields, OWID.svg 850 × 600; 140 KB
-
 Coffee-bean-production.png 3,400 × 2,400; 832 KB
-
 Corn production.png 3,400 × 2,400; 782 KB
-
 Cost-healthy-diet.png 3,400 × 2,400; 740 KB
-
 Daily meat consumption per person, OWID.svg 850 × 600; 139 KB
-
 Daily meat consumption per person.svg 850 × 600; 152 KB
-
 Daily per capita caloric supply, OWID.svg 850 × 600; 142 KB
-
 Daily per capita fat supply, OWID.svg 850 × 600; 141 KB
-
 Daily per capita protein supply, OWID.svg 850 × 600; 143 KB
-
 Does livestock antibiotic use exceed suggested target., OWID.svg 850 × 600; 139 KB
-
 Egg production, OWID.svg 850 × 600; 142 KB
-
 Eggs per bird, OWID.svg 850 × 600; 141 KB
-
 Employment in agriculture (% of total employment), OWID.svg 850 × 600; 140 KB
-
 Employment in Agriculture.png 1,652 × 1,012; 343 KB
-
 Excess-nitrogen (OWID 0343).png 850 × 600; 121 KB
-
 Excess-nitrogen-per-hectare (OWID 0342).png 850 × 600; 119 KB
-
 Excess-phosphorous (OWID 0340).png 850 × 600; 117 KB
-
 Excess-phosphorous-per-hectare (OWID 0341).png 850 × 600; 110 KB
-
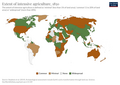
 Extent-of-extensive-agriculture (OWID 0333).png 850 × 600; 105 KB
-
 Extent-of-foraging (OWID 0335).png 850 × 600; 104 KB
-
 Extent-of-intensive-agriculture (OWID 0331).png 850 × 600; 104 KB
-
 Extent-of-pastoralism (OWID 0332).png 850 × 600; 103 KB
-
 Extent-of-urbanization (OWID 0334).png 850 × 600; 90 KB
-
 Farm-size-change (OWID 0452).png 850 × 600; 97 KB
-
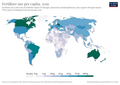
 Fertilizer use in kg per hectare of arable land, OWID.svg 850 × 600; 140 KB
-
 Fertilizer-per-capita (OWID 0447).png 850 × 600; 103 KB
-
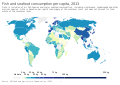 Fish and seafood consumption per capita, OWID.svg 850 × 600; 141 KB
-
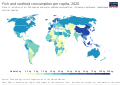 Fish-and-seafood-consumption-per-capita-map.svg 850 × 600; 166 KB
-
 Fish-seafood-production (OWID 0432).png 850 × 600; 100 KB
-
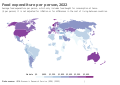 Food expenditure per person per year, OWID.svg 850 × 600; 148 KB
-
 Food-share-total-emissions (OWID 0421).png 850 × 600; 116 KB
-
 Fruit consumption per capita, OWID.svg 850 × 600; 140 KB
-
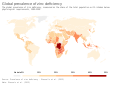 Global prevalence of zinc deficiency, OWID.svg 850 × 600; 140 KB
-
 Global-prevalence-of-zinc-deficiency.png 3,400 × 2,400; 748 KB
-
 Groundnut yield, OWID.svg 850 × 600; 148 KB
-
 Groundnuts-yield (OWID 0519).png 850 × 600; 89 KB
-
 Impact-climate-maize-percentage (OWID 0499).png 850 × 600; 113 KB
-
 Income-small-scale-food-producers.png 3,400 × 2,400; 751 KB
-
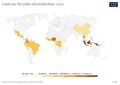 Land-use-palm-oil (OWID 0587).png 850 × 600; 83 KB
-
 Lettuce-yields (OWID 0574).png 850 × 600; 92 KB
-
 Maize production, OWID.svg 850 × 600; 140 KB
-
 Maize yields, OWID.svg 850 × 600; 140 KB
-
 Maize-attainable-yield (OWID 0557).png 850 × 600; 109 KB
-
 Maize-yield-gap (OWID 0552).png 850 × 600; 105 KB
-
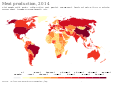 Meat production, OWID.svg 850 × 600; 142 KB
-
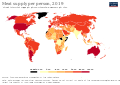
 Meat supply per person, OWID.svg 850 × 600; 141 KB
-
 Meat Supply per Person.svg 850 × 600; 164 KB
-
 Meat-production-tonnes (OWID 0662).png 850 × 600; 110 KB
-
 Methane-emissions-agriculture (OWID 0666).png 850 × 600; 102 KB
-
 Milk per animal, OWID.svg 850 × 600; 140 KB
-
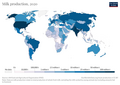
 Milk production, OWID.svg 850 × 600; 140 KB
-
 Milk-production-tonnes (OWID 0660).png 850 × 600; 104 KB
-
 Milk-yields-per-animal (OWID 0657).png 850 × 600; 101 KB
-
 Millet-yield (OWID 0658).png 850 × 600; 88 KB
-
 Nitrogen fertilizer application per hectare of cropland, OWID.svg 850 × 600; 141 KB
-
 Nitrogen-inputs-per-hectare (OWID 0624).png 850 × 600; 108 KB
-
 Nitrogen-use-efficiency (OWID 0623).png 850 × 600; 112 KB
-
 Nitrous-oxide-agriculture (OWID 0620).png 850 × 600; 102 KB
-
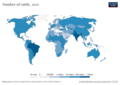
 Number of cattle, OWID.svg 850 × 600; 141 KB
-
 Number of pigs, OWID.svg 850 × 600; 141 KB
-
 Number of poultry birds, OWID.svg 850 × 600; 140 KB
-
 Number-of-accessions-of-plant-genetic-resources-secured-in-conservation-facilities.png 3,400 × 2,400; 819 KB
-
 Number-of-different-crops-grown (OWID 0734).png 850 × 600; 101 KB
-
 Number-of-farms (OWID 0733).png 850 × 600; 104 KB
-
 Olive oil production, world map, OWID.svg 850 × 600; 156 KB
-
 Onset-year-intensive-agriculture (OWID 0700).png 850 × 600; 97 KB
-
 Orange production, OWID.svg 850 × 600; 140 KB
-
 Orange yields, OWID.svg 850 × 600; 140 KB
-
 Palm-oil-imports (OWID 0681).png 850 × 600; 92 KB
-
 Palm-oil-yields (OWID 0680).png 850 × 600; 85 KB
-
 Pea-production (OWID 0674).png 850 × 600; 93 KB
-
 Pea-yields (OWID 0673).png 850 × 600; 90 KB
-
 Per capita egg consumption, OWID.svg 850 × 600; 141 KB
-
 Per capita milk consumption, OWID.svg 850 × 600; 140 KB
-
 Per-capita-co2-food-deforestation (1).svg 850 × 600; 167 KB
-
 Per-capita-nitrous-oxide (OWID 0742).png 850 × 600; 98 KB
-
 Pesticide use per hectare of cropland, OWID.svg 850 × 600; 140 KB
-
 Pesticide-use-tonnes (OWID 0851).png 850 × 600; 102 KB
-
 Phosphate application per hectare of cropland, OWID.svg 850 × 600; 141 KB
-
 Phosphorous-inputs-per-hectare (OWID 0850).png 850 × 600; 108 KB
-
 Pig meat per animal, OWID.svg 850 × 600; 140 KB
-
 Pig-livestock-count-heads (OWID 0847).png 850 × 600; 95 KB
-
 Pig-yields-meat-per-animal-in-hectograms-100-grams (OWID 0846).png 850 × 600; 94 KB
-
 Pigmeat production, OWID.svg 850 × 600; 141 KB
-
 Pigmeat-production-tonnes (OWID 0845).png 850 × 600; 107 KB
-
 Pigmeat-production-tonnes.png 3,400 × 2,400; 782 KB
-
 Potash fertilizer application per hectare of cropland, OWID.svg 850 × 600; 140 KB
-
 Potato production, OWID.svg 850 × 600; 140 KB
-
 Potato yields, OWID.svg 850 × 600; 142 KB
-
 Poultry meat per animal, OWID.svg 850 × 600; 140 KB
-
 Poultry production, OWID.svg 850 × 600; 141 KB
-
 Poultry-livestock-count (OWID 0814).png 850 × 600; 93 KB
-
 Poultry-production-tonnes (OWID 0812).png 850 × 600; 104 KB
-
 Poultry-yields-meat-per-animal (OWID 0813).png 850 × 600; 87 KB
-
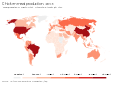
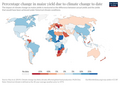
 Prevalence-of-vitamin-a-deficiency-in-children.png 3,400 × 2,400; 763 KB
-

-

-
 Proportion-of-animal-breeds-genetic-conservation.png 3,400 × 2,400; 799 KB
-
 Proportion-of-local-breeds-at-risk-of-extinction.png 3,400 × 2,400; 867 KB
-
 Protection-of-the-rights-of-small-scale-fisheries (OWID 0884).png 850 × 600; 102 KB
-
 Protection-of-the-rights-of-small-scale-fisheries.png 3,400 × 2,400; 843 KB
-
 Rapeseed yields, OWID.svg 850 × 600; 139 KB
-
 Ratification-and-accession-to-unclos (OWID 0879).png 850 × 600; 106 KB
-
 Regulation-illegal-fishing (OWID 0869).png 850 × 600; 108 KB
-
 Regulation-illegal-fishing-map.png 3,400 × 2,400; 819 KB
-
 Rice production, OWID.svg 850 × 600; 140 KB
-
 Rice yields, OWID.svg 850 × 600; 140 KB
-
 Rye-production (OWID 0961).png 850 × 600; 92 KB
-
 Rye-yield (OWID 0959).png 850 × 600; 90 KB
-
 Sesame-seed-production (OWID 0951).png 850 × 600; 90 KB
-
 Share of agricultural land which is irrigated, OWID.svg 850 × 600; 141 KB
-
 Share of agricultural landowners who are female, OWID.svg 850 × 600; 140 KB
-

-
 Share of households consuming iodized salt, OWID.svg 850 × 600; 140 KB
-
 Share of land area used for agriculture, OWID.svg 850 × 600; 141 KB
-
 Share of land area used for arable agriculture, OWID.svg 850 × 600; 141 KB
-
 Share of land area used for permanent meadows and pastures, OWID.svg 850 × 600; 142 KB
-
 Share of population with moderate or severe food insecurity, OWID.svg 850 × 600; 141 KB
-
 Share of population with severe food insecurity, OWID.svg 850 × 600; 141 KB
-
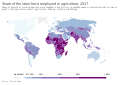 Share of the labor force employed in agriculture, OWID.svg 850 × 600; 140 KB
-
 Share-agriculture-smallholder-farms (OWID 0947).png 850 × 600; 98 KB
-
 Share-cereal-human-food (OWID 0946).png 850 × 600; 118 KB
-
 Share-cereals-animal-feed (OWID 0943).png 850 × 600; 107 KB
-
 Share-cereals-industrial-uses (OWID 0944).png 850 × 600; 107 KB
-
 Share-farms-smallholders (OWID 0909).png 850 × 600; 98 KB
-
 Share-global-excess-nitrogen (OWID 1015).png 850 × 600; 121 KB
-
 Share-global-excess-phosphorous (OWID 1014).png 850 × 600; 117 KB
-
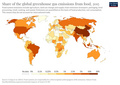 Share-global-food-emissions (OWID 1013).png 850 × 600; 120 KB
-
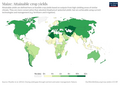
 Share-of-fish-stocks-that-are-sustainably-fished.png 3,400 × 2,400; 856 KB
-
 Share-of-households-consuming-iodized-salt.png 3,400 × 2,400; 787 KB
-
 Sorghum-yield (OWID 1083).png 850 × 600; 86 KB
-
 Soybean yields, OWID.svg 850 × 600; 141 KB
-
 Soybean-production (OWID 1078).png 850 × 600; 96 KB
-
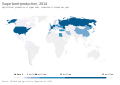 Sugar beet production, OWID.svg 850 × 600; 139 KB
-
 Sugar cane production, OWID.svg 850 × 600; 140 KB
-
 Sugar cane yields, OWID.svg 850 × 600; 141 KB
-
 Sugar-beet-yields (OWID 1069).png 850 × 600; 89 KB
-
 Sunflower-seed-production (OWID 1067).png 850 × 600; 93 KB
-
 Sunflower-seed-yield (OWID 1062).png 850 × 600; 93 KB
-
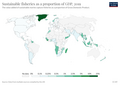 Sustainable-fisheries-as-a-proportion-of-gdp (OWID 1059).png 850 × 600; 94 KB
-
 Sustainable-fisheries-as-a-proportion-of-gdp-map.png 3,400 × 2,400; 826 KB
-
 Sweet-potato-production (OWID 1058).png 850 × 600; 92 KB
-
 Tea production, OWID.svg 850 × 600; 139 KB
-
 Tea yields, OWID.svg 850 × 600; 139 KB
-
 Tobacco production, OWID.svg 850 × 600; 161 KB
-
 Tomato yields, OWID.svg 850 × 600; 147 KB
-
 Tomato-production (OWID 1042).png 850 × 600; 96 KB
-
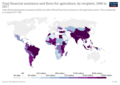 Total financial assistance and flows for agriculture by recipient.png 3,400 × 2,400; 780 KB
-
 Total-applied-phosphorous-crops (OWID 1035).png 850 × 600; 106 KB
-
 Total-nitrogen-inputs-crops (OWID 1032).png 850 × 600; 108 KB
-
 Tractors-per-100-square-kilometres-of-arable-land.png 3,072 × 1,920; 469 KB
-
 Value of agricultural production, OWID cs.svg 850 × 599; 147 KB
-
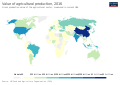 Value of agricultural production, OWID.svg 850 × 600; 161 KB


.svg)
.png)
.png)


.png)
.png)

.png)


.png)


.png)


.png)


.png)
.png)


.png)

.png)

.png)
.png)


_in_per_capita_caloric_intake,_OWID.svg)


,_OWID.svg)

.png)
.png)
.png)
.png)
.png)
.png)
.png)
.png)
.png)
.png)

.png)


.png)

.png)


.png)
.png)

.png)
.png)


.png)
.png)


.png)
.png)


.png)
.png)
.png)

.png)
.png)
.png)


.png)
.png)

.png)


.png)
.png)
.png)
.png)


.svg)
.png)

.png)

.png)

.png)
.png)

.png)


.png)
.png)
.png)


.png)


.png)
.png)


.png)
.png)
.png)


.png)
.png)
.png)
.png)
.png)
.png)
.png)
.png)


.png)

.png)


.png)
.png)
.png)
.png)

.png)


.png)

.png)
.png)


