Category:Our World in Data finance and GDP maps of the world
Jump to navigation
Jump to search
Subcategories
This category has the following 2 subcategories, out of 2 total.
Media in category "Our World in Data finance and GDP maps of the world"
The following 87 files are in this category, out of 87 total.
-
 Agriculture-share-gdp (OWID 0017).png 850 × 600; 99 KB
-
 Aid received per capita, OWID.svg 850 × 600; 140 KB
-
 Annual growth of GDP per capita, OWID.svg 850 × 600; 140 KB
-
 Atms per 100000 adults.png 3,400 × 2,400; 821 KB
-
 Automated teller machines (ATMs), OWID.svg 850 × 600; 140 KB
-
 Average-price-of-a-pack-of-cigarettes 2012.png 3,101 × 1,824; 491 KB
-
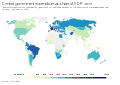 Central government expenditure as share of GDP, OWID.svg 850 × 600; 141 KB
-
 Co2-intensity.png 3,400 × 2,400; 862 KB
-
 Commercial bank branches, OWID.svg 850 × 600; 141 KB
-
 Consumption-based-carbon-intensity (OWID 0255).png 850 × 600; 112 KB
-
 Cost-calorie-sufficient-diet.png 3,400 × 2,400; 742 KB
-
 Country Programmable Aid (CPA) received, OWID.svg 850 × 600; 140 KB
-
 Debt Service of Exports of Goods and Services.png 3,400 × 2,400; 819 KB
-
 Debt-service-of-exports-of-goods-services.png 3,400 × 2,400; 798 KB
-
 Direct disaster economic loss as a share of GDP, OWID.svg 850 × 600; 141 KB
-
 Direct Disaster Loss as a Share of GDP.png 3,400 × 2,400; 736 KB
-
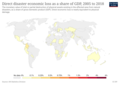
 Direct-disaster-loss-as-a-share-of-gdp.png 3,400 × 2,400; 819 KB
-
 Domestic-material-consumption-per-unit-of-gdp (OWID 0279).png 850 × 600; 112 KB
-
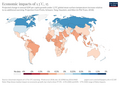 Econimpact15c (OWID 0273).png 850 × 600; 114 KB
-
 Econimpact2c (OWID 0271).png 850 × 600; 116 KB
-
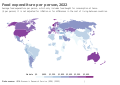 Food expenditure per person per year, OWID.svg 850 × 600; 148 KB
-
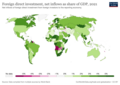
 Foreign direct investment, net outflows as share of GDP, OWID.svg 850 × 600; 141 KB
-
 Foreign-direct-investment-net-inflows-as-share-of-gdp.png 3,400 × 2,400; 791 KB
-
 Foreign-direct-investment-net-outflows-of-gdp.png 3,400 × 2,400; 841 KB
-
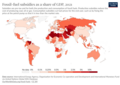
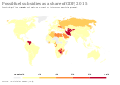 Fossil-fuel subsidies as a share of GDP, OWID.svg 850 × 600; 139 KB
-
 Fossil-fuel-subsidies-gdp-2021.png 3,400 × 2,400; 921 KB
-
 Fossil-fuel-subsidies-gdp.png 3,400 × 2,400; 865 KB
-
 Fossil-fuel-subsidies-gdp.svg 850 × 600; 168 KB
-
 GDP in British pounds, OWID.svg 850 × 600; 139 KB
-
 GDP per capita (Clio Infra (1500 to 2010)), OWID.svg 850 × 600; 141 KB
-
 GDP per capita (Maddison – multiple benchmark), OWID.svg 850 × 600; 141 KB
-
 GDP per capita (World Bank (1990 to 2017)), OWID.svg 850 × 600; 141 KB
-
 GDP per capita in US$ (World Bank (1960 to 2017)), OWID.svg 850 × 600; 140 KB
-
 GDP Per Capita, 2018.png 3,400 × 2,400; 791 KB
-
 GDP price levels relative to the US, OWID.svg 850 × 600; 142 KB
-
 GDP, 2018.png 1,650 × 1,050; 340 KB
-
 Gdp-per-capita-growth.png 3,400 × 2,400; 792 KB
-
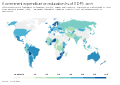 Government expenditure on education (% of GDP), OWID.svg 850 × 600; 140 KB
-

-
 Government expenditure on primary education as share of GDP, OWID.svg 850 × 600; 142 KB
-
 Government expenditure on secondary education as share of GDP, OWID.svg 850 × 600; 141 KB
-
 Government expenditure on tertiary education as share of GDP, OWID.svg 850 × 600; 141 KB
-
 Government revenue as a share of GDP, OWID.svg 850 × 600; 141 KB
-
 Government spending, OWID.svg 850 × 600; 140 KB
-
 Government-revenues-as-a-share-of-gdp-imf.png 3,400 × 2,400; 806 KB
-
 Gross Domestic Product (World Bank (1960 to 2017)), OWID.svg 850 × 600; 147 KB
-
 Growth rate of real GDP per employed person, OWID.svg 850 × 600; 140 KB
-
 Growth-rate-of-real-gdp-per-employed-person.png 3,400 × 2,400; 761 KB
-
 Inflation-of-consumer-prices.png 3,400 × 2,400; 805 KB
-
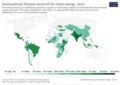
 International finance received for clean energy, OWID.svg 850 × 600; 140 KB
-
 International-finance-clean-energy (OWID 0604).png 850 × 600; 107 KB
-
 International-finance-clean-energy.png 3,400 × 2,400; 872 KB
-
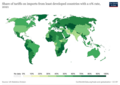
 Labour share of gross domestic product, OWID.svg 850 × 600; 140 KB
-
 Labour-share-of-gdp.png 3,400 × 2,400; 825 KB
-
 Manufacturing-value-added-to-gdp.png 3,400 × 2,400; 807 KB
-
 Money-committed-to-public-private-partnerships-for-infrastructure.png 3,400 × 2,400; 844 KB
-
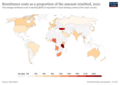
 Personal remittances as a share of GDP, OWID.svg 850 × 600; 142 KB
-
 Personal-remittances-received-of-gdp.png 3,400 × 2,400; 857 KB
-
 Proportion-of-domestic-budget-funded-by-domestic-taxes-of-gdp.png 3,400 × 2,400; 799 KB
-
 Proportion-tariff-lines-applied-to-imports-from-ldcs.png 3,400 × 2,400; 752 KB
-
 Remittance-costs-as-share-of-amount-remitted.png 3,400 × 2,400; 799 KB
-
 Research & development spending as a share of GDP.png 3,400 × 2,400; 837 KB
-
 Research-and-development-expenditure-of-gdp.png 3,400 × 2,400; 786 KB
-
 Research-spending-gdp.png 3,400 × 2,400; 826 KB
-
 Share of adults with account at a financial institution, OWID.svg 850 × 600; 141 KB
-
 Share of consumer expenditure spent on food, OWID.svg 850 × 600; 147 KB
-
 Share of domestic budget funded by domestic taxes, OWID.svg 850 × 600; 141 KB
-
 Share of government expenditure going to interest payments, OWID.svg 850 × 600; 142 KB
-
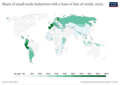 Smalsmall-scale-industries-loan.png 3,400 × 2,400; 774 KB
-
 Spending on research and development as share of GDP, OWID.svg 850 × 600; 141 KB
-
 Sustainable-fisheries-as-a-proportion-of-gdp-map.png 3,400 × 2,400; 826 KB
-
 Tax revenues as a share of GDP.png 3,400 × 2,400; 803 KB
-
 Taxes-as-share-of-cigarette-price.png 3,129 × 1,873; 497 KB
-
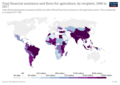 Total financial assistance and flows for agriculture by recipient.png 3,400 × 2,400; 780 KB
-

-
 Total natural resources rents (% of GDP), OWID.svg 850 × 600; 140 KB
-

-
 Total wealth per capita, 1, OWID.svg 850 × 600; 139 KB
-
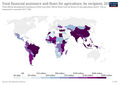 Total-financial-assistance-and-flows-for-agriculture-by-recipient.png 3,400 × 2,400; 797 KB
-
 Total-gov-expenditure-gdp-wdi.png 3,400 × 2,400; 846 KB
-
 Total-government-revenue-of-gdp 2017.png 3,400 × 2,400; 718 KB
-
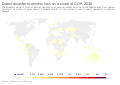
 Total-government-revenue-of-gdp 2020.png 3,400 × 2,400; 816 KB
-
 Total-tax-revenues-gdp.png 3,098 × 1,920; 509 KB
-
 Tourism-gdp-proportion-of-total-gdp.png 3,400 × 2,400; 802 KB
-
 Trade – exports plus imports – as share of GDP, OWID.svg 850 × 600; 141 KB
-
 Trade-as-share-of-gdp.png 3,400 × 2,400; 792 KB
-
 Water-productivity.png 3,400 × 2,400; 815 KB
.png)


,_OWID.svg)


.png)

_received,_OWID.svg)


.png)
.png)
.png)


),_OWID.svg)
,_OWID.svg)
),_OWID.svg)
),_OWID.svg)


,_OWID.svg)


),_OWID.svg)


.png)


,_OWID.svg)


