Category:Our World in Data - Poverty and Economic Development
Jump to navigation
Jump to search
Subcategories
This category has only the following subcategory.
*
Media in category "Our World in Data - Poverty and Economic Development"
The following 111 files are in this category, out of 111 total.
-
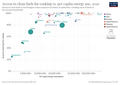
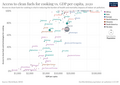
 Access to clean fuels for cooking vs. GDP per capita, OWID.svg 850 × 600; 42 KB
-
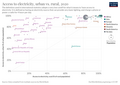
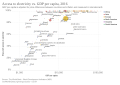 Access to electricity vs. GDP per capita, OWID.svg 850 × 600; 44 KB
-
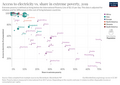
 Access to electricity, urban vs. rural, OWID.svg 850 × 600; 45 KB
-
 Access-drinking-water-stacked.png 3,400 × 2,400; 475 KB
-
 Access-to-basic-resources.png 3,400 × 2,400; 410 KB
-
-
 Access-to-clean-fuels-for-cooking-vs-gdp-per-capita (OWID 0010).png 850 × 600; 98 KB
-
-
 Access-to-electricity-urban-vs-rural (OWID 0011).png 850 × 600; 96 KB
-
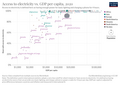 Access-to-electricity-vs-gdp-per-capita (OWID 0041).png 850 × 600; 105 KB
-
 Additional-extreme-poverty-climate-challenges (OWID 0037).png 850 × 600; 126 KB
-
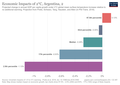 ArgentinaImpact.png 3,400 × 2,400; 417 KB
-
 Average hourly earnings of male and female employees, OWID.svg 850 × 600; 8 KB
-
 Average hours of work per week, by industry, OWID.svg 850 × 600; 17 KB
-
 Average hours worked per person employed, OWID.svg 850 × 600; 19 KB
-

-
 Death rate from cancers vs. extreme poverty, OWID.svg 850 × 600; 26 KB
-
 Death-rate-from-unsafe-water-sources-vs-share-in-extreme-poverty.png 3,400 × 2,400; 484 KB
-
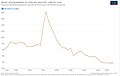
 Development of extreme poverty in India.jpg 1,029 × 650; 43 KB
-

-

-
 Econimpact2c.png 3,400 × 2,400; 448 KB
-
 Econimpact2vs15c (OWID 0270).png 850 × 600; 65 KB
-
 Economic Complexity Index (ECI) by country ranking, OWID.svg 850 × 600; 29 KB
-
 Economic complexity rank vs. GDP per capita, OWID.svg 850 × 600; 22 KB
-
 Economic Freedom Global Ranking, OWID.svg 850 × 600; 139 KB
-
 Economic Freedom Score, OWID.svg 850 × 600; 140 KB
-
 Economic Impacts of 1.5°C, OWID.svg 850 × 600; 141 KB
-
 Economic Impacts of 2°C vs 1.5°C, OWID.svg 850 × 600; 141 KB
-
 Economic Impacts of 2°C, OWID.svg 850 × 600; 141 KB
-
 Economic inequality – Gini Index, OWID.svg 850 × 600; 140 KB
-
 Employment in agriculture vs GDP per capita, OWID.svg 850 × 600; 42 KB
-
 Employment in agriculture vs. urban population, OWID.svg 850 × 600; 44 KB
-
 Employment in the coal industry in the United Kingdom, OWID.svg 850 × 600; 9 KB
-
 Employment rate with tertiary vs vocational education, OWID.svg 850 × 600; 14 KB
-
 Employment rates of 25-34 year-olds by education level, OWID.svg 850 × 600; 16 KB
-
 Employment-to-population ratio, men vs women, OWID.svg 850 × 600; 32 KB
-
-
 Extreme poverty and child mortality, OWID.svg 850 × 600; 27 KB
-
 Extreme-Poverty-projection-by-the-World-Bank-to-2030.png 3,000 × 2,100; 248 KB
-
 Extreme-poverty-vs-prevalence-of-underweight-children.png 3,400 × 2,400; 562 KB
-
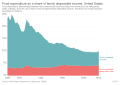 Food expenditure as a share of family disposable income, OWID.svg 850 × 600; 10 KB
-
 Global Hunger Index vs. extreme poverty, OWID.svg 850 × 600; 62 KB
-
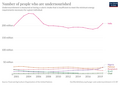
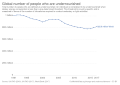 Global number of people who are undernourished, OWID.svg 850 × 600; 6 KB
-
 Globalization over 5 centuries, 1, OWID.svg 850 × 600; 21 KB
-
 Globalization over 5 centuries, 2, OWID.svg 850 × 600; 13 KB
-
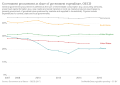
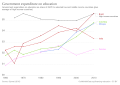 Government expenditure on education, OWID.svg 850 × 600; 9 KB
-
 Government expenditure on primary education by country, OWID.svg 850 × 600; 13 KB
-

-

-

-
-
 Government Revenues as a share of national income, OWID.svg 850 × 600; 7 KB
-
 Government Transparency Index, OWID.svg 850 × 600; 155 KB
-
 Hidden Hunger Index vs. extreme poverty, OWID.svg 850 × 600; 27 KB
-

-

-
 National poverty lines vs. GDP per capita, OWID.svg 850 × 600; 23 KB
-
 Number of people defined as undernourished, OWID.svg 850 × 600; 7 KB
-
 Number of people living in urban slum households, OWID.svg 850 × 600; 6 KB
-
 Number of severely food insecure people by region, OWID.svg 850 × 600; 7 KB
-
 Number-of-severely-food-insecure-people-by-region.png 3,400 × 2,400; 502 KB
-
 Number-undernourished (OWID 0717).png 850 × 600; 63 KB
-
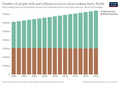 Number-with-without-clean-cooking-fuels (OWID 0714).png 850 × 600; 57 KB
-
 People without access to electricity by region, OWID.svg 850 × 600; 15 KB
-
 People-without-clean-cooking-fuels-region (OWID 0800).png 850 × 600; 58 KB
-

-
 Poverty headcount rate vs. poverty gap, OWID.svg 850 × 600; 27 KB
-
 Poverty headcount ratio (Povcal vs. WDI), OWID.svg 850 × 600; 16 KB
-
 Poverty in Bangladesh.jpg 1,014 × 650; 43 KB
-
 Poverty in China.jpg 1,022 × 648; 43 KB
-
 Poverty in DR Congo.jpg 1,022 × 646; 41 KB
-
 Poverty in Ethiopia.jpg 1,034 × 648; 47 KB
-
 Poverty in Ghana.jpg 1,028 × 649; 44 KB
-
 Poverty in Indonesia.jpg 1,020 × 647; 46 KB
-
 Poverty in Mexico.jpg 1,024 × 651; 49 KB
-
 Poverty in Pakistan.jpg 1,011 × 646; 44 KB
-
 Poverty in the Philippines.jpg 1,031 × 648; 44 KB
-
 Poverty in Vietnam.jpg 1,034 × 646; 46 KB
-
 Poverty in Zimbabwe.jpg 1,042 × 650; 49 KB
-
 Poverty rate (-60% of median) (LIS Key Figures), OWID.svg 850 × 600; 6 KB
-
 Poverty vs. Life expectancy, OWID.svg 850 × 600; 26 KB
-

-

-
 Prevalence of underweight children vs. extreme poverty, OWID.svg 850 × 600; 20 KB
-

-
-

-
 SDF hommes femmes nuit selon OCDE 2023.jpg 1,199 × 902; 240 KB
-

-

-

-

-

-

-

-
 Share-of-population-in-extreme-poverty.png 3,400 × 2,975; 649 KB
-
 Share-of-the-population-living-in-extreme-poverty-in-selected-parts-of-the-world.png 3,400 × 2,400; 550 KB
-
 The global poverty gap, in international-$, OWID.svg 850 × 600; 5 KB
-
 The number of people below different poverty lines.svg 850 × 600; 23 KB
-

-
-
-
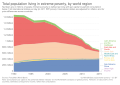
 Total-population-living-in-extreme-poverty-by-world-region.png 3,400 × 2,400; 619 KB
-

-
 Vaccination coverage vs. share in extreme poverty - Mexico, OWID.png 3,400 × 2,400; 419 KB
-
 World population living in extreme poverty - Our World in Data - 2015.png 1,200 × 800; 105 KB
-

-
 World-population-in-extreme-poverty-absolute.svg 850 × 600; 11 KB
-

-


.png)
.png)
.png)
.png)
.png)
.png)


,_OWID.svg)


.png)
_by_country_ranking,_OWID.svg)


_vs_Life_expectancy_at_birth,_OWID.svg)


,_OWID.svg)


,_OWID.svg)


.png)
.png)

.png)


,_OWID.svg)


_(LIS_Key_Figures),_OWID.svg)

_in_developing_countries_since_1970,_OWID.svg)


),_OWID.svg)
.png)
.png)


),_OWID.svg)


),_OWID.svg)

_vs._share_of_the_population_living_in_extreme_poverty,_OWID.svg)


),_OWID.svg)

,_OWID.svg)
,_OWID.svg)