Category:Organizational diagrams uploaded by User:Mdd
Jump to navigation
Jump to search
Organizational charts, diagrams and tables uploaded by User:Mdd
Media in category "Organizational diagrams uploaded by User:Mdd"
The following 162 files are in this category, out of 162 total.
-
01 Comparison of Statistical and Graphical Presentation.jpg 2,170 × 777; 107 KB
-
02 Graphic Record of Progress of Operations.jpg 2,243 × 1,469; 285 KB
-
03 Manufacturing Control and Schedule.jpg 1,898 × 1,049; 450 KB
-
04 A Plotting of Operation Sequence.jpg 2,117 × 954; 302 KB
-
05 Re-plotting of Operation Sequence Shown in 04.jpg 1,664 × 1,327; 279 KB
-
06 Steps in Introduction of Production Control.jpg 2,103 × 3,710; 865 KB
-
A Chart of Working Authorities in a Manufacturing Business, 1910.jpg 551 × 906; 76 KB
-
An Innovation Competence Process Coming From Knowledge Management.jpg 577 × 755; 257 KB
-
Banking Influence in Large Corporations, 1914.jpg 3,020 × 1,830; 702 KB
-
Building design Support Environment.jpg 801 × 732; 170 KB
-
Business Model Prototyping and Customer Development V2.jpg 1,295 × 758; 102 KB
-
Business Strategy and IT Alignment.jpg 800 × 600; 73 KB
-
Business Unites Cooperate in Producing Services, 1921.jpg 811 × 625; 84 KB
-
Business Unites in producing the Service of Money, 1921.jpg 805 × 451; 68 KB
-
C. & G. Railroad Loss & Gain accounts, 1908.jpg 1,121 × 816; 147 KB
-
Canton Plow Company Loss & Gain accounts, 1908.jpg 1,108 × 961; 174 KB
-
Change of business and change in Agent's expenditure, 1885.jpg 910 × 497; 221 KB
-
Change of expenditure by change of occupation, 1885.jpg 516 × 741; 153 KB
-
Channels of distribution for various lines of goods, 1915.jpg 1,008 × 582; 70 KB
-
Channels of distribution, Co-Operative Fruit Marketing,, 1915.jpg 983 × 689; 110 KB
-
Channels of distribution, Drugs and Shoes, 1915.jpg 985 × 472; 63 KB
-
Channels of distribution, Harvesting Machinery, 1915.jpg 497 × 554; 41 KB
-
Channels of distribution, Heavy Hardware and Silverware, 1915.jpg 999 × 492; 58 KB
-
Channels of distribution, Textiles, 1915.jpg 998 × 666; 105 KB
-
Chart of a Corporate Manufacturing Enterprise, 1909.jpg 909 × 1,485; 409 KB
-
Chart of a Corporate Trading Enterprise, 1909.jpg 929 × 1,503; 400 KB
-
Chart of Advertising Department, 1905.jpg 951 × 1,426; 79 KB
-
Chart of Business Organization, 1905.jpg 831 × 1,491; 112 KB
-
Chart of Corporate Commercial Expenses and Manufacturing Expenses, 1909.jpg 1,414 × 892; 293 KB
-
Chart of Cost Summarizing Records and Procedures, 1919.jpg 1,839 × 1,196; 281 KB
-
Chart of Factory Ledger Controlling Accounts, 1919.jpg 1,536 × 809; 244 KB
-
Chart of Interborough-Metropolitan System, New York, 1909.jpg 4,248 × 2,864; 1.74 MB
-
Chart of Manufacturing Costs, 1905.jpg 898 × 562; 68 KB
-
Chart of Order Department, 1905.jpg 1,116 × 719; 58 KB
-
Chart of Purchasing Department, 1905.jpg 860 × 1,476; 143 KB
-
Chart of Sales Department, 1905.jpg 1,399 × 870; 143 KB
-
Chart of Shipping Department, 1905.jpg 1,115 × 708; 79 KB
-
Chart of Stock Department, 1905.jpg 917 × 1,453; 99 KB
-
Chart of the Government of the United States, 2011.jpg 1,287 × 811; 221 KB
-
Chart of Total Construction Costs, 1909.jpg 1,700 × 1,040; 388 KB
-
Chart Showing Analysis of Cost Elements, 1919.jpg 1,046 × 1,451; 223 KB
-
Chart Showing Books under Product Cost System, 1922.jpg 1,520 × 971; 313 KB
-
Chart Showing Classes of Costs, 1922.jpg 702 × 186; 24 KB
-
Chart Showing Common Classification of Expense Accounts, 1916.jpg 1,062 × 1,505; 168 KB
-
Chart Showing Handling of Material and Material Reports, 1919.jpg 1,515 × 929; 201 KB
-
Chart showing Internal Organization of Department Store, 1915.jpg 985 × 607; 92 KB
-
Chart showing Internal Organization of Specialty Store, 1915.jpg 914 × 547; 63 KB
-
Chart Showing Interrelation of Detailed Records, 1922.jpg 802 × 415; 77 KB
-
Chart Showing Methods of Cost-Finding Applied to Various Industries, 1919.jpg 1,538 × 852; 197 KB
-
Chart Showing Primary Subdivision of Proprietorship, 1916.jpg 1,903 × 1,182; 132 KB
-
Circuit flow of money by W.T. Foster, 1922.jpg 780 × 1,286; 211 KB
-
Circular flow of goods income.png 2,000 × 1,500; 101 KB
-
Circular flow of income and expenditure.jpg 590 × 343; 33 KB
-
Circular flow of income.jpg 535 × 1,012; 64 KB
-
Classification Chart of Cost Sheets, 1919.jpg 1,531 × 763; 171 KB
-
Classification Chart of Factory Departments, 1919.jpg 1,521 × 650; 146 KB
-
Classification chart of Factory Ledger Accounts, 1919 (1).jpg 681 × 590; 124 KB
-
Classification chart of Factory Ledger Accounts, 1919 (2).jpg 688 × 596; 117 KB
-
Classification Chart of Factory Orders, 1919.jpg 1,516 × 848; 189 KB
-
Classification Chart of Factory Overhead, 1919.jpg 1,545 × 927; 215 KB
-
Classification chart of General Ledger Accounts, 1919 (1).jpg 1,015 × 1,390; 308 KB
-
Classification chart of General Ledger Accounts, 1919 (2).jpg 1,037 × 1,400; 255 KB
-
Classification Chart of Labor Reports, 1919.jpg 1,538 × 820; 167 KB
-
Classification Chart of Production Reports, 1919.jpg 1,520 × 929; 249 KB
-
Cooperating Specialized Business Units (after Nystrom), 1921.jpg 797 × 467; 68 KB
-
Cooperating specialized business units in Egg Production, 1921.jpg 788 × 586; 62 KB
-
Corporation finance circular flows, 1909.jpg 1,266 × 782; 136 KB
-
Corporation finance pyramid, 1909.jpg 881 × 569; 91 KB
-
Correspondence Card, 1885.jpg 872 × 1,141; 176 KB
-
Costs of Operating and Maintaining a Railroad, 1857.jpg 944 × 1,360; 151 KB
-
Diagram of Expenditure and Results, showing the relations between departments, 1897.jpg 2,054 × 3,216; 708 KB
-
Diagram of Manufacturing Accounts, 1896.jpg 2,369 × 1,695; 798 KB
-
Diagram of the Federal Government and American Union.jpg 4,775 × 3,660; 6.66 MB
-
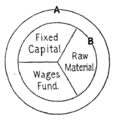
Diagram of Wages-Fund Theory, 1885.png 544 × 575; 59 KB
-
Diagram of want-gratifying goods, 1921.jpg 1,039 × 261; 44 KB
-
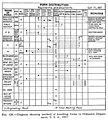
Diagram showing method of handling forms in Ordnance Department, U.S.A, 1917.jpg 1,247 × 1,391; 362 KB
-
Diagram Showing Relations of Cost Elements to Selling Price, 1919.jpg 1,027 × 946; 100 KB
-
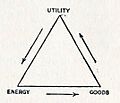
Economic Life triange, 1909.jpg 535 × 458; 34 KB
-
Economic Life triange, the reverse, 1909.jpg 701 × 561; 46 KB
-
Economic production and distribution, 1904.jpg 787 × 389; 57 KB
-
Economic value, price and distribution, 1904.jpg 790 × 653; 106 KB
-
Electricity Market Complex Adaptive System (1).jpg 400 × 294; 85 KB
-
Electricity Market Complex Adaptive System (2).jpg 400 × 327; 118 KB
-
Essential Aids to Factory Accounting, 1917.jpg 1,663 × 2,392; 581 KB
-
Executive President Cabinet, 1862.jpg 589 × 589; 62 KB
-
Factory accounts, Books and Forms used in connection with Prime Cost (1922).jpg 1,169 × 1,572; 212 KB
-
Factory accounts, Books and Forms used in connection with Prime Cost.jpg 1,164 × 1,580; 165 KB
-
Factory accounts, Books and Forms used in connection with Stock.jpg 1,563 × 1,152; 245 KB
-
Factory accounts, Books and Forms used in connection with Stores.jpg 1,485 × 1,085; 226 KB
-
Factory accounts, Books and Forms used in connection with Wages.jpg 1,087 × 803; 120 KB
-
Father Hagerty's Wheel of Fortune, 1905.jpg 800 × 792; 212 KB
-
Genealogy of the Early English Tool Builders, 1915.png 727 × 808; 816 KB
-
General ledger, classification of accounts, 1909.jpg 1,268 × 1,030; 108 KB
-
General subdivision of the departments of a machine shop, 1903.jpg 976 × 684; 159 KB
-
Graphic Illustration of Flow of Cost Procedures, 1921.jpg 3,196 × 2,004; 827 KB
-
Graphic Representation of Processes and Routing in a Representative Plant, 1914.jpg 1,096 × 1,534; 323 KB
-
Greater New York Public Utility Family Tree, 1904.jpg 2,049 × 1,625; 283 KB
-
Greater Steam Railroad Groups, 1904.jpg 2,009 × 1,722; 406 KB
-
HHS business areas.jpg 709 × 588; 68 KB
-
HP and IBM Business Model.jpg 551 × 461; 107 KB
-
Huxham Security Framework.jpg 1,207 × 943; 150 KB
-
Industrial Management Channels, 1917.jpg 888 × 1,184; 290 KB
-
Industrial Organization Chart, 1921.jpg 2,514 × 1,111; 297 KB
-
Kringloopmodel van de economie.jpg 596 × 454; 36 KB
-
Logical tree embracing various conceivable kinds of arbitration law, 1905.jpg 2,577 × 1,538; 216 KB
-
Machine-industrie in kringloopmodel van de economie.jpg 609 × 567; 76 KB
-
Manufacture of Wooden Cloth under Domestic System, 1921.jpg 807 × 550; 68 KB
-
Method of payment for American purchase of foreign goods, 1919.jpg 1,548 × 764; 161 KB
-
Northwestern Construction Company Loss & Gain accounts, 1908.jpg 1,119 × 633; 126 KB
-
Organization Chart of a large Company Manufacturing Stoves, 1914.jpg 1,556 × 909; 226 KB
-
Organization of an Arsenal, 1885.jpg 895 × 452; 84 KB
-
Organizational diagram of the New York and Erie Railroad, 1855 bottom half.tif 4,961 × 3,973; 18.8 MB
-
Organizational diagram of the New York and Erie Railroad, 1855 top half.tif 4,971 × 3,994; 11.14 MB
-
Organizational diagram of the New York and Erie Railroad, 1855.jpg 3,885 × 6,125; 3.05 MB
-
Our national chart, a supplement to the Cincinnati Weekly Times for 1866.jpg 10,482 × 6,939; 14.77 MB
-
Outline of Organization Chart, 1914.jpg 3,110 × 2,024; 713 KB
-
Pandora's Web2.0 Business Model.jpg 575 × 461; 70 KB
-
Plan of Organization for National Livestock Producers Association (2), 1928.jpg 1,101 × 1,361; 199 KB
-
Prime and Working Authorities of an Industrial Body.jpg 960 × 510; 192 KB
-
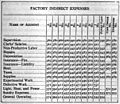
Prime expenditure divisions of a factory.jpg 2,341 × 1,073; 351 KB
-
Prime Organization Elements of an Industrial Body.jpg 2,383 × 1,278; 454 KB
-
Progressing Case Study Design.jpg 800 × 600; 59 KB
-
Refining processes and routing in refinery for Pennsylvania crude petroleum, 1921.jpg 1,613 × 1,237; 346 KB
-
Scheme of authority of Railroad Company, 1894.jpg 1,041 × 1,595; 319 KB
-
Scheme of Quesnay's Tableau Economique, 1921.jpg 709 × 1,219; 365 KB
-
Segregation of an Industrial Body into Authorities and Departments.jpg 2,121 × 2,540; 795 KB
-
Society, Public Treasury and Bondholders, 1885.jpg 389 × 324; 87 KB
-
SouthCarolinaRR Schedule1841.jpg 571 × 888; 93 KB
-
Staff Organisation Diagram, 1896.jpg 1,679 × 1,039; 246 KB
-
Stakeholder (nl).JPG 693 × 437; 55 KB
-
Syracuse Gas Co. Loss & Gain accounts, 1908.jpg 1,120 × 1,033; 195 KB
-
Tabulating Machine Co Organization Chart.jpg 3,747 × 2,189; 1.35 MB
-
The competitive price system adapted from Samuelson, 1961.jpg 938 × 707; 101 KB
-
The Rockefeller-Morgan Family Tree, 1904.jpg 1,799 × 1,475; 419 KB
-
The Round Flow of Money Income and Expenditure, 1922.jpg 1,371 × 2,241; 342 KB
-
The seven Builders and leading spirits of the revolution, 1862.jpg 699 × 699; 79 KB
-
The Way to Get Work Out, 1921.jpg 2,848 × 1,430; 831 KB
-
Thinking on the Wall - last spots left.jpg 600 × 800; 63 KB
-
Ticketcorner's Business Model Design in Post-It Format.jpg 800 × 600; 73 KB
-
United States Rubber Company organization chart, 1902.jpg 1,421 × 916; 391 KB
-
Universe Concept map.jpg 484 × 499; 21 KB
-
USDA Office of Operations and Finance, 1981.jpg 2,044 × 1,380; 280 KB
-
USSC Org chart.png 8,207 × 5,658; 42.44 MB
-
Visualizing your process mapping problems, 1921.jpg 2,992 × 2,806; 1.74 MB
-
Web2.0 Business Model Characteristics.png 1,451 × 853; 92 KB
-
What Makes a Man an Executive, 1921.jpg 1,486 × 1,764; 392 KB
-
Wheeled chart of National Bureau of Standards activities, 1915.jpg 1,469 × 789; 241 KB


