Category:Old weather and climate maps
Jump to navigation
Jump to search
Subcategories
This category has only the following subcategory.
H
- Hann Atlas der Meteorologie (24 F)
Media in category "Old weather and climate maps"
The following 35 files are in this category, out of 35 total.
-
 1809 watersnood.jpg 6,503 × 3,497; 3.63 MB
-

-
 501 of 'Physical description of New South Wales and Van Diemen's land' (11023513365).jpg 1,443 × 2,346; 354 KB
-
 Askeregnen-1875-03-mohn-1877.jpg 2,046 × 1,287; 872 KB
-
 Brockhaus and Efron Encyclopedic Dictionary b47 024-0.jpg 1,577 × 2,736; 1.43 MB
-
 Brockhaus and Efron Encyclopedic Dictionary b54 026-3.jpg 1,691 × 2,339; 936 KB
-
 Charts Showing Humidity, also Wet and Dry Bulb Isotherms Fig 53-54.png 2,526 × 3,941; 327 KB
-
 EB9 United States - rainfall chart.jpg 2,426 × 1,713; 1.12 MB
-
 EB9 United States - temperature chart.jpg 2,414 × 1,705; 2.01 MB
-
 Iconographic Encyclopedia of Science, Literature and Art 040.jpg 2,304 × 2,860; 1.02 MB
-
 Iconographic Encyclopedia of Science, Literature and Art 041.jpg 2,860 × 2,304; 1.48 MB
-

-
-

-
-

-
 Kerstvloed 1717.jpg 600 × 513; 97 KB
-
 Meyers b11 s0411a.jpg 2,048 × 1,577; 624 KB
-
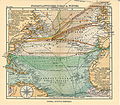
 Meyer‘s Zeitungsatlas 089 – Windkarte der Erde.jpg 7,393 × 6,258; 10.94 MB
-
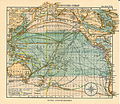
 Meyer‘s Zeitungsatlas 098 – Karte vom Großen Ocean (Mare Pacifico).jpg 7,441 × 6,258; 16.75 MB
-
 Nordatlantik.jpg 4,555 × 3,974; 7.33 MB
-
 PSM V02 D415 Weather chart.jpg 1,738 × 2,881; 1.84 MB
-
 PSM V16 D306 Weather map western hemisphere 130 to 50 longitude.jpg 1,029 × 627; 106 KB
-
 PSM V16 D306 World weather map jan 25 1878.jpg 1,096 × 1,274; 272 KB
-
 PSM V16 D456 Weather map eastern hemisphere 50 to 130 longitude.jpg 1,024 × 553; 105 KB
-
 Rainfall of the Caucasus (Élisée Reclus).JPG 470 × 363; 42 KB
-
 Stiller ozean.jpg 4,555 × 3,956; 7.07 MB
-
 Weihnachtsflut 1717.jpg 985 × 811; 432 KB
-
 Weihnachtsflut61.jpg 2,048 × 1,749; 2.46 MB
-
 Woodbridge isothermal chart.jpg 3,360 × 2,636; 4.57 MB
-
 Woodbridge isothermal chart2.jpg 3,357 × 2,628; 6.24 MB
-
 Woodbridge isothermal chart3.jpg 3,338 × 2,413; 6.24 MB
-
 World Wind Chart fig 143 January February March.jpg 5,504 × 3,833; 5.17 MB
-
 World Wind Chart fig 144 July August September.jpg 5,504 × 3,833; 5.35 MB
-
 Zugstrassen der barometrischen Minima.jpg 824 × 777; 188 KB


.jpg)


%27_(11225171934).jpg)
%27_(11235359023).jpg)
%27_(16404371259).jpg)


.jpg)


.JPG)


