Category:OWID climate graphics upload
Jump to navigation
Jump to search
Media in category "OWID climate graphics upload"
The following 200 files are in this category, out of 900 total.
(previous page) (next page)-
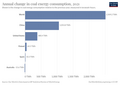
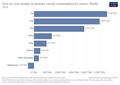
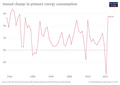
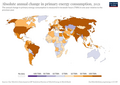 Abs-change-energy-consumption (OWID 0007).png 850 × 600; 107 KB
-
 Absolute-change-co2 (OWID 0005).png 850 × 600; 102 KB
-
 Absolute-number-of-deaths-from-household-air-pollution (OWID 0003).png 850 × 600; 103 KB
-
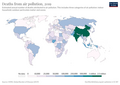
 Absolute-number-of-deaths-from-outdoor-air-pollution (OWID 0002).png 850 × 600; 97 KB
-
-
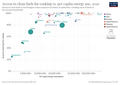
 Access-to-clean-fuels-for-cooking-vs-gdp-per-capita (OWID 0010).png 850 × 600; 98 KB
-
-
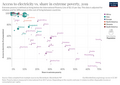
 Access-to-electricity-urban-vs-rural (OWID 0011).png 850 × 600; 96 KB
-
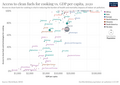
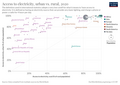
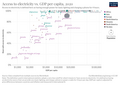 Access-to-electricity-vs-gdp-per-capita (OWID 0041).png 850 × 600; 105 KB
-
 Ace-north-atlantic-hurricanes (OWID 0040).png 850 × 600; 73 KB
-
 Acres-burned-per-wildfire-usa (OWID 0038).png 850 × 600; 52 KB
-
 Acres-burned-usa (OWID 0039).png 850 × 600; 52 KB
-
 Additional-extreme-poverty-climate-challenges (OWID 0037).png 850 × 600; 126 KB
-
 African-elephants (OWID 0035).png 850 × 600; 47 KB
-
 Agri-yields-uk (OWID 0033).png 850 × 600; 66 KB
-
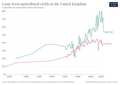
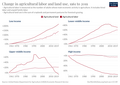 Agricultural-labor-land (OWID 0030).png 850 × 600; 91 KB
-
 Agricultural-land (OWID 0024).png 850 × 600; 97 KB
-
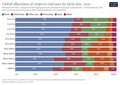
 Agricultural-land-area-by-farm-size (OWID 0029).png 850 × 600; 73 KB
-
 Agricultural-land-irrigation (OWID 0023).png 850 × 600; 107 KB
-
 Agricultural-output-dollars (OWID 0026).png 850 × 600; 51 KB
-
 Agricultural-water-withdrawals-vs-gdp-per-capita (OWID 0025).png 850 × 600; 117 KB
-
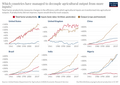 Agriculture-decoupling-productivity (OWID 0021).png 850 × 600; 118 KB
-
 Agriculture-land-fao (OWID 0020).png 850 × 600; 38 KB
-
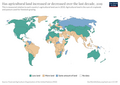 Agriculture-more-less-land (OWID 0019).png 850 × 600; 103 KB
-
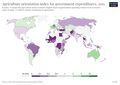 Agriculture-orientation-index (OWID 0018).png 850 × 600; 102 KB
-
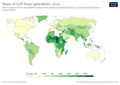 Agriculture-share-gdp (OWID 0017).png 850 × 600; 99 KB
-
 Agriculture-value-added-per-worker-vs-gdp-per-capita (OWID 0016).png 850 × 600; 91 KB
-

-
 Air-pollution-deaths-by-age (OWID 0074).png 850 × 600; 59 KB
-
 Air-pollution-deaths-country (OWID 0012).png 850 × 600; 101 KB
-
 Air-pollution-london (OWID 0075).png 850 × 600; 55 KB
-
 Air-pollution-london-vs-delhi (OWID 0076).png 850 × 600; 50 KB
-
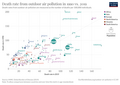
 Air-pollution-vs-gdp-per-capita (OWID 0073).png 850 × 600; 72 KB
-
 Ambient-pollution-death-rates-2017-1990 (OWID 0072).png 850 × 600; 97 KB
-
 Animal-protein-consumption (OWID 0070).png 850 × 600; 73 KB
-
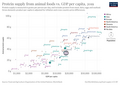 Animal-protein-vs-gdp (OWID 0069).png 850 × 600; 98 KB
-
 Animals-slaughtered-for-meat (OWID 0068).png 850 × 600; 58 KB
-
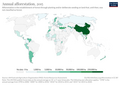 Annual-afforestation (OWID 0067).png 850 × 600; 112 KB
-
 Annual-change-coal (OWID 0066).png 850 × 600; 49 KB
-
 Annual-change-fossil-fuels (OWID 0062).png 850 × 600; 107 KB
-
 Annual-change-gas (OWID 0065).png 850 × 600; 102 KB
-
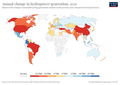 Annual-change-hydro (OWID 0063).png 850 × 600; 102 KB
-
 Annual-change-low-carbon-energy (OWID 0061).png 850 × 600; 108 KB
-
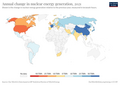 Annual-change-nuclear (OWID 0059).png 850 × 600; 99 KB
-
 Annual-change-oil (OWID 0058).png 850 × 600; 99 KB
-
 Annual-change-primary-energy-source (OWID 0060).png 850 × 600; 60 KB
-
 Annual-change-renewables (OWID 0057).png 850 × 600; 110 KB
-
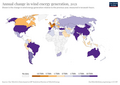
 Annual-change-solar (OWID 0056).png 850 × 600; 104 KB
-
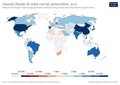
 Annual-change-wind (OWID 0054).png 850 × 600; 101 KB
-
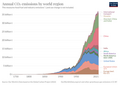 Annual-co-emissions-by-region (OWID 0055).png 850 × 600; 81 KB
-
 Annual-co-emissions-from-other-industry (OWID 0053).png 850 × 600; 87 KB
-
 Annual-co2-cement (OWID 0052).png 850 × 600; 48 KB
-
 Annual-co2-coal (OWID 0051).png 850 × 600; 97 KB
-
 Annual-co2-emissions-per-country (OWID 0048).png 850 × 600; 65 KB
-
 Annual-co2-flaring (OWID 0050).png 850 × 600; 93 KB
-
 Annual-co2-gas (OWID 0049).png 850 × 600; 95 KB
-
 Annual-co2-including-land-use (OWID 0044).png 850 × 600; 112 KB
-
 Annual-co2-oil (OWID 0046).png 850 × 600; 94 KB
-
 Annual-fish-catch-taxa (OWID 0043).png 850 × 600; 106 KB
-
 Annual-forest-expansion (OWID 0045).png 850 × 600; 121 KB
-
 Annual-percentage-change-coal (OWID 0105).png 850 × 600; 47 KB
-
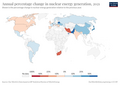
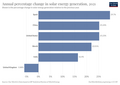
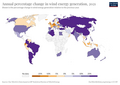
 Annual-percentage-change-fossil-fuels (OWID 0104).png 850 × 600; 102 KB
-
 Annual-percentage-change-gas (OWID 0106).png 850 × 600; 97 KB
-
 Annual-percentage-change-hydro (OWID 0103).png 850 × 600; 49 KB
-
 Annual-percentage-change-low-carbon (OWID 0101).png 850 × 600; 52 KB
-
 Annual-percentage-change-nuclear (OWID 0102).png 850 × 600; 97 KB
-
 Annual-percentage-change-oil (OWID 0099).png 850 × 600; 45 KB
-
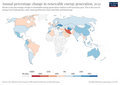 Annual-percentage-change-renewables (OWID 0097).png 850 × 600; 106 KB
-
 Annual-percentage-change-solar (OWID 0098).png 850 × 600; 48 KB
-
 Annual-percentage-change-wind (OWID 0100).png 850 × 600; 101 KB
-
 Annual-primary-energy-fossil-vs-low-carbon (OWID 0096).png 850 × 600; 52 KB
-
 Annual-share-of-co2-emissions (OWID 0093).png 850 × 600; 84 KB
-
 Aquaculture-farmed-fish-production (OWID 0095).png 850 × 600; 74 KB
-
 Arable-land-pin (OWID 0090).png 850 × 600; 57 KB
-
 Arctic-sea-ice-coverage-19352014 (OWID 0091).png 850 × 600; 61 KB
-
 Area-land-needed-to-global-oil (OWID 0089).png 850 × 600; 65 KB
-
 Area-meadows-and-pastures (OWID 0087).png 850 × 600; 107 KB
-
 Area-per-tonne-oil (OWID 0088).png 850 × 600; 61 KB
-
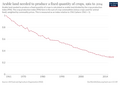
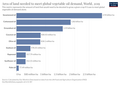
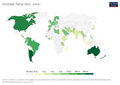 Average-farm-size (OWID 0085).png 850 × 600; 93 KB
-
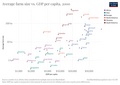 Average-farm-size-vs-gdp (OWID 0084).png 850 × 600; 75 KB
-
 Average-precipitation-per-year (OWID 0083).png 850 × 600; 105 KB
-
 Battery-plugin-hybrid-vehicles (OWID 0082).png 850 × 600; 67 KB
-
 Beach-litter (OWID 0081).png 850 × 600; 92 KB
-
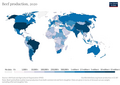 Beef-and-buffalo-meat-production-tonnes (OWID 0080).png 850 × 600; 105 KB
-
 Biofuel-production (OWID 0077).png 850 × 600; 62 KB
-
 Biofuels-production-by-region (OWID 0079).png 850 × 600; 73 KB
-
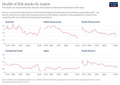 Biomass-fish-stocks-region (OWID 0078).png 850 × 600; 81 KB
-
 Biomass-fish-stocks-taxa (OWID 0140).png 850 × 600; 62 KB
-
 Biomass-vs-abundance-taxa (OWID 0137).png 850 × 600; 65 KB
-
 Bird-populations-eu (OWID 0139).png 850 × 600; 55 KB
-
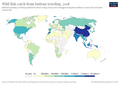 Bottom-trawling (OWID 0138).png 850 × 600; 104 KB
-
 Bp-country-coverage (OWID 0136).png 850 × 600; 87 KB
-
 Budget-to-manage-invasive-alien-species (OWID 0135).png 850 × 600; 101 KB
-
 But-so-is-the-quality-of-their-local-environment (OWID 0133).png 850 × 600; 98 KB
-
 But-so-is-the-quality-of-their-local-environment-finn (OWID 0134).png 850 × 600; 101 KB
-
 Capture-and-aquaculture-production (OWID 0132).png 850 × 600; 60 KB
-
 Capture-fisheries-vs-aquaculture (OWID 0131).png 850 × 600; 67 KB
-
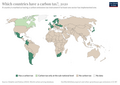
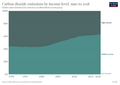
 Carbon-dioxide-emissions-are-higher-in-richer-countries (OWID 0127).png 850 × 600; 103 KB
-

-
 Carbon-dioxide-emissions-factor (OWID 0130).png 850 × 600; 78 KB
-
 Carbon-emissions-trading-system (OWID 0125).png 850 × 600; 100 KB
-
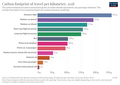 Carbon-footprint-travel-mode (OWID 0123).png 850 × 600; 81 KB
-
 Carbon-intensity-vs-gdp (OWID 0124).png 850 × 600; 96 KB
-
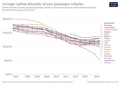 Carbon-new-passenger-vehicles (OWID 0122).png 850 × 600; 115 KB
-
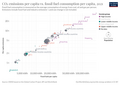
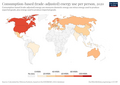
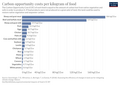 Carbon-opportunity-costs-per-kilogram-of-food (OWID 0120).png 850 × 600; 92 KB
-
 Carbon-tax-instruments (OWID 0119).png 850 × 600; 100 KB
-
 Carbon-tax-trading-coverage (OWID 0118).png 850 × 600; 106 KB
-
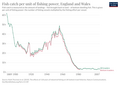 Catch-fishing-power-uk (OWID 0117).png 850 × 600; 75 KB
-
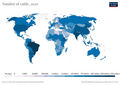 Cattle-livestock-count-heads (OWID 0116).png 850 × 600; 95 KB
-
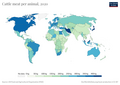 Cattle-meat-yields-hectograms-100-grams-per-animal (OWID 0115).png 850 × 600; 93 KB
-
 Cereal-crop-yield-vs-fertilizer-application (OWID 0112).png 850 × 600; 84 KB
-
 Cereal-distribution-to-uses (OWID 0113).png 850 × 600; 63 KB
-
 Cereal-land-spared (OWID 0114).png 850 × 600; 58 KB
-
 Cereal-production (OWID 0111).png 850 × 600; 103 KB
-
 Cereal-yield-vs-extreme-poverty (OWID 0109).png 850 × 600; 74 KB
-
 Cereal-yield-vs-extreme-poverty-scatter (OWID 0110).png 850 × 600; 117 KB
-
 Cereal-yield-vs-gdp-per-capita (OWID 0108).png 850 × 600; 92 KB
-
 Cereal-yields-uk (OWID 0170).png 850 × 600; 110 KB
-
 Cereal-yields-vs-gdp-per-capita (OWID 0171).png 850 × 600; 82 KB
-
 Cereal-yields-vs-tractor-inputs-in-agriculture (OWID 0169).png 850 × 600; 121 KB
-
 Cereals-human-food-vs-gdp (OWID 0167).png 850 × 600; 120 KB
-
 Cereals-imports-vs-exports (OWID 0168).png 850 × 600; 106 KB
-
 Change-calories-climate-yield (OWID 0166).png 850 × 600; 107 KB
-
 Change-co2-annual-pct (OWID 0165).png 850 × 600; 101 KB
-
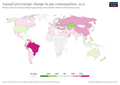
 Change-energy-consumption (OWID 0163).png 850 × 600; 60 KB
-
 Change-energy-gdp-per-capita (OWID 0164).png 850 × 600; 81 KB
-
 Change-forest-area-share-total (OWID 0162).png 850 × 600; 116 KB
-
 Change-forest-vs-gdp (OWID 0161).png 850 × 600; 102 KB
-
 Change-global-hunger-index-pop-growth (OWID 0160).png 850 × 600; 103 KB
-
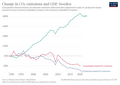
 Change-in-cfc-11-concentrations (OWID 0157).png 850 × 600; 69 KB
-
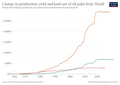 Change-in-production-yield-and-land-palm (OWID 0156).png 850 × 600; 58 KB
-
 Change-in-total-mangrove-area (OWID 0159).png 850 × 600; 92 KB
-
 Change-marine-mammals (OWID 0158).png 850 × 600; 66 KB
-
 Change-of-cereal-yield-vs-land-used (OWID 0155).png 850 × 600; 69 KB
-
 Change-population-gdp-meat (OWID 0153).png 850 × 600; 54 KB
-
 Chinese-plastic-imports (OWID 0150).png 850 × 600; 54 KB
-
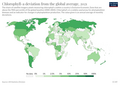 Chlorophyll-a-deviation-from-the-global-average (OWID 0149).png 850 × 600; 114 KB
-
 Co-emissions-by-sector (OWID 0151).png 850 × 600; 74 KB
-
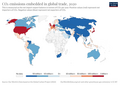 Co-emissions-embedded-in-global-trade (OWID 0146).png 850 × 600; 109 KB
-
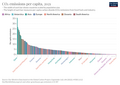
 Co-emissions-per-capita (OWID 0144).png 850 × 600; 102 KB
-
-
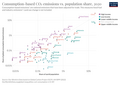
 Co-emissions-per-capita-vs-population-growth (OWID 0148).png 850 × 600; 97 KB
-
-
 CO2-by-source (OWID 0142).png 850 × 600; 58 KB
-
 Co2-deforestation-for-food (OWID 0143).png 850 × 600; 124 KB
-
 Co2-emissions-and-gdp (OWID 0200).png 850 × 600; 71 KB
-
 Co2-emissions-and-gdp-long-term (OWID 0141).png 850 × 600; 61 KB
-
 Co2-emissions-aviation (OWID 0198).png 850 × 600; 103 KB
-
 Co2-emissions-by-fuel-line (OWID 0196).png 850 × 600; 60 KB
-
 Co2-emissions-domestic-aviation (OWID 0199).png 850 × 600; 102 KB
-
 Co2-emissions-transport (OWID 0197).png 850 × 600; 101 KB
-
 Co2-emissions-vs-gdp (OWID 0195).png 850 × 600; 94 KB
-
 Co2-gdp-growth (OWID 0193).png 850 × 600; 92 KB
-
 Co2-gdp-pop-growth (OWID 0194).png 850 × 600; 101 KB
-
 Co2-income-level (OWID 0192).png 850 × 600; 44 KB
-
 Co2-international-aviation (OWID 0191).png 850 × 600; 101 KB
-
 Co2-land-use (OWID 0189).png 850 × 600; 108 KB
-
 Co2-land-use-global-share (OWID 0190).png 850 × 600; 106 KB
-
 Co2-land-use-per-capita (OWID 0187).png 850 × 600; 104 KB
-
 Co2-mitigation-15c (OWID 0188).png 850 × 600; 146 KB
-
 Co2-mitigation-2c (OWID 0185).png 850 × 600; 146 KB
-
 Co2-per-capita-marimekko (OWID 0184).png 850 × 600; 75 KB
-
 Co2-per-capita-vs-renewable-electricity (OWID 0183).png 850 × 600; 100 KB
-
 Co2-per-unit-energy (OWID 0181).png 850 × 600; 86 KB
-
 Co2-transport-mode (OWID 0182).png 850 × 600; 70 KB
-
 Coal-by-end-user-uk (OWID 0180).png 850 × 600; 82 KB
-
 Coal-consumption-by-country-terawatt-hours-twh (OWID 0175).png 850 × 600; 99 KB
-
 Coal-electricity-per-capita (OWID 0177).png 850 × 600; 96 KB
-
 Coal-energy-share (OWID 0178).png 850 × 600; 100 KB
-
 Coal-output-uk-tonnes (OWID 0176).png 850 × 600; 64 KB
-
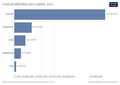 Coal-prod-per-capita (OWID 0263).png 850 × 600; 42 KB
-
 Coal-production-by-country (OWID 0261).png 850 × 600; 63 KB
-
 Coal-production-country (OWID 0262).png 850 × 600; 69 KB
-
 Coal-production-in-the-united-kingdom (OWID 0260).png 850 × 600; 64 KB
-
 Coal-uk-opencast-deep-mine (OWID 0254).png 850 × 600; 66 KB
-
 Coal-vs-gdp-per-capita (OWID 0256).png 850 × 600; 91 KB
-
 Consumption-based-carbon-intensity (OWID 0255).png 850 × 600; 112 KB
-
 Consumption-based-energy-per-capita (OWID 0253).png 850 × 600; 107 KB
-
 Consumption-co2-emissions (OWID 0252).png 850 × 600; 110 KB
-
 Consumption-co2-emissions-vs-population (OWID 0251).png 850 × 600; 91 KB
-
 Consumption-co2-per-capita (OWID 0247).png 850 × 600; 108 KB
-
 Consumption-co2-per-capita-equity (OWID 0250).png 850 × 600; 111 KB
-
 Consumption-energy-intensity (OWID 0249).png 850 × 600; 121 KB
-
 Consumption-vs-production-co2-per-capita (OWID 0245).png 850 × 600; 85 KB
-
 Coral-bleaching-events (OWID 0244).png 850 × 600; 60 KB
-
 Corn-production-land-us (OWID 0242).png 850 × 600; 73 KB
-

-
-

-
 Countries-to-montreal-protocol-and-vienna-convention (OWID 0238).png 850 × 600; 102 KB
-

-

-
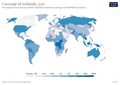 Coverage-of-wetlands (OWID 0234).png 850 × 600; 93 KB
-
 Crop-allocation-farm-size (OWID 0229).png 850 × 600; 88 KB
-
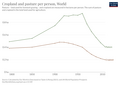 Cropland-pasture-per-person (OWID 0232).png 850 × 600; 53 KB
-
 Crude-oil-spot-prices (OWID 0226).png 850 × 600; 78 KB
-
 Cumulative-co-emissions-from-other-industry (OWID 0225).png 850 × 600; 88 KB
-
 Cumulative-co2-cement (OWID 0223).png 850 × 600; 94 KB
-
 Cumulative-co2-coal (OWID 0222).png 850 × 600; 101 KB
-
 Cumulative-co2-emissions-region (OWID 0221).png 850 × 600; 76 KB
.png)
.png)
.png)
.png)
.png)
.png)
.png)
.png)
.png)
.png)
.png)
.png)
.png)
.png)
.png)
.png)
.png)
.png)
.png)
.png)
.png)
.png)
.png)
.png)
.png)
.png)
.png)
.png)
.png)
.png)
.png)
.png)
.png)
.png)
.png)
.png)
.png)
.png)
.png)
.png)
.png)
.png)
.png)
.png)
.png)
.png)
.png)
.png)
.png)
.png)
.png)
.png)
.png)
.png)
.png)
.png)
.png)
.png)
.png)
.png)
.png)
.png)
.png)
.png)
.png)
.png)
.png)
.png)
.png)
.png)
.png)
.png)
.png)
.png)
.png)
.png)
.png)
.png)
.png)
.png)
.png)
.png)
.png)
.png)
.png)
.png)
.png)
.png)
.png)
.png)
.png)
.png)
.png)
.png)
.png)
.png)
.png)
.png)
.png)
.png)
.png)
.png)
.png)
.png)
.png)
.png)
.png)
.png)
.png)
.png)
.png)
.png)
.png)
.png)
.png)
.png)
.png)
.png)
.png)
.png)
.png)
.png)
.png)
.png)
.png)
.png)
.png)
.png)
.png)
.png)
.png)
.png)
.png)
.png)
.png)
.png)
.png)
.png)
.png)
.png)
.png)
.png)
.png)
.png)
.png)
.png)
.png)
.png)
.png)
.png)
.png)
.png)
.png)
.png)
.png)
.png)
.png)
.png)
.png)
.png)
.png)
.png)
.png)
.png)
.png)
.png)
.png)
.png)
.png)
.png)
.png)
.png)
.png)
.png)
.png)
.png)
.png)
.png)
.png)
.png)
.png)
.png)
.png)
.png)
.png)
.png)
.png)
.png)
.png)
.png)
.png)
.png)
.png)
.png)
.png)
.png)
.png)
.png)
.png)
.png)