Category:Nyquist plots
Jump to navigation
Jump to search
plot  | |||||
| Upload media | |||||
| Instance of | |||||
|---|---|---|---|---|---|
| Subclass of | |||||
| Named after | |||||
| |||||
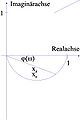
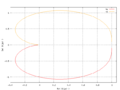
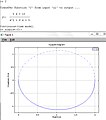
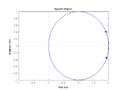
A nyquist plot is used in automatic control and signal processing for assessing the stability of a system with feedback. It is represented by a graph in polar coordinates in which the gain and phase of a frequency response are plotted.
Media in category "Nyquist plots"
The following 59 files are in this category, out of 59 total.
-

-
 ButterworthFilter40Percent3rdOrder-de.svg 670 × 590; 220 KB
-
 CriticalFrequencyAliasing.png 1,200 × 900; 13 KB
-
 Diag nyquist.JPG 493 × 386; 24 KB
-
 Diagrama de Nyquist.png 418 × 420; 12 KB
-
 Diagramme de Nyquist - Mesure de la marge de gain.png 1,367 × 651; 9 KB
-
 Fok-i.png 1,024 × 506; 8 KB
-
 GrapheZRCparallele.png 180 × 134; 5 KB
-
 Luoghi a modulo costante diagramma di Nyquist.png 462 × 383; 4 KB
-
 Minimum and maximum phase responses.gif 450 × 450; 573 KB
-
 Nyqist Ortskurve.jpg 311 × 467; 7 KB
-
 Nyquist 1 over (s+1).png 560 × 420; 8 KB
-
 Nyquist 1 over (s+1)2.png 560 × 420; 9 KB
-
 Nyquist 1 over (s+1)3.png 560 × 420; 9 KB
-
 Nyquist 1 over s(s+1)2.png 560 × 420; 8 KB
-
 Nyquist 1.png 610 × 676; 31 KB
-
 Nyquist 10.png 633 × 481; 130 KB
-
 Nyquist 2.png 479 × 379; 10 KB
-
 Nyquist 3.png 743 × 617; 36 KB
-
 Nyquist 4.png 896 × 483; 70 KB
-
 Nyquist 5.png 1,034 × 429; 264 KB
-
 Nyquist 6.png 807 × 182; 32 KB
-
 Nyquist 7.png 1,079 × 298; 89 KB
-
 Nyquist 8.png 889 × 691; 216 KB
-
 Nyquist Amplitude.jpg 573 × 326; 10 KB
-
 Nyquist Criteria.svg 691 × 515; 8 KB
-
 Nyquist diagram.png 493 × 386; 6 KB
-
 Nyquist example.png 640 × 480; 5 KB
-
 Nyquist example.svg 443 × 428; 53 KB
-
 Nyquist Ortskurve.svg 321 × 402; 8 KB
-
 Nyquist Phase Margin.svg 357 × 326; 18 KB
-
 Nyquist plot.svg 427 × 342; 17 KB
-
 Nyquist screen.jpg 543 × 613; 122 KB
-
 Nyquist-d.png 512 × 384; 3 KB
-
 Nyquist-i.png 512 × 384; 3 KB
-
 Nyquist-p.png 512 × 384; 4 KB
-
 Nyquist-pt1 2.png 512 × 384; 4 KB
-
 Nyquist-pt1.png 512 × 384; 5 KB
-
 Nyquist-pt2-var.png 512 × 384; 6 KB
-
 Nyquist-pt2.png 512 × 384; 5 KB
-
 Nyquist-PT2.svg 525 × 395; 102 KB
-
 Nyquist.jpg 567 × 383; 49 KB
-
 NyquistAmplitude.svg 573 × 326; 20 KB
-
 Nyquistdiagram.png 434 × 403; 4 KB
-
 NyquistPT1Tt.svg 512 × 512; 19 KB
-
 OrtsImp.svg 800 × 473; 68 KB
-
 Ortskurve Hochpass.svg 360 × 200; 30 KB
-
 Ortskurve Imp R(p)L.svg 520 × 300; 37 KB
-
 Ortskurve Imp RC.svg 540 × 310; 36 KB
-
 Ortskurve Imp RL.svg 540 × 310; 35 KB
-
 Ortskurve Schwing Par.svg 460 × 400; 150 KB
-
 Ortskurve Schwing Rei.svg 200 × 300; 132 KB
-
 Ortskurve Tiefpass.svg 360 × 220; 29 KB
-
 Ortskurve(kompl).svg 486 × 380; 44 KB
-
 OrtsPT2.svg 800 × 672; 58 KB
-
 OrtsTief.svg 800 × 438; 52 KB
-
 Przyklad nyquist.png 466 × 415; 9 KB
-
 Spec i nyquistdiagram.png 482 × 457; 7 KB
-
 Spezielles Nyquistkriterium.svg 800 × 800; 19 KB


.png)
2.png)
3.png)
2.png)


L.svg)


.svg)


