Category:NUTS maps of England
Jump to navigation
Jump to search
Media in category "NUTS maps of England"
The following 47 files are in this category, out of 47 total.
-
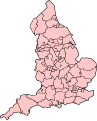 BlankMap-EnglandNUTS3Areas.svg 2,121 × 2,629; 234 KB
-
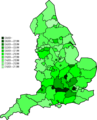
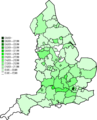 Map of NUTS 3 areas in England by GVA per capita (1995).png 2,121 × 2,629; 592 KB
-
 Map of NUTS 3 areas in England by GVA per capita (1995).svg 2,121 × 2,629; 243 KB
-
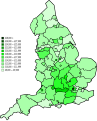
 Map of NUTS 3 areas in England by GVA per capita (1996).png 2,121 × 2,629; 592 KB
-
 Map of NUTS 3 areas in England by GVA per capita (1996).svg 2,121 × 2,629; 243 KB
-
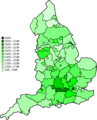
 Map of NUTS 3 areas in England by GVA per capita (1997).png 2,121 × 2,629; 591 KB
-
 Map of NUTS 3 areas in England by GVA per capita (1997).svg 2,121 × 2,629; 243 KB
-
 Map of NUTS 3 areas in England by GVA per capita (1998).png 2,121 × 2,629; 587 KB
-
 Map of NUTS 3 areas in England by GVA per capita (1998).svg 2,121 × 2,629; 243 KB
-
 Map of NUTS 3 areas in England by GVA per capita (1999).png 2,121 × 2,629; 578 KB
-
 Map of NUTS 3 areas in England by GVA per capita (1999).svg 2,121 × 2,629; 243 KB
-
 Map of NUTS 3 areas in England by GVA per capita (2000).png 2,121 × 2,629; 576 KB
-
 Map of NUTS 3 areas in England by GVA per capita (2000).svg 2,121 × 2,629; 243 KB
-
 Map of NUTS 3 areas in England by GVA per capita (2001).png 2,121 × 2,629; 568 KB
-
 Map of NUTS 3 areas in England by GVA per capita (2001).svg 2,121 × 2,629; 243 KB
-
 Map of NUTS 3 areas in England by GVA per capita (2002).png 2,121 × 2,629; 563 KB
-
 Map of NUTS 3 areas in England by GVA per capita (2002).svg 2,121 × 2,629; 243 KB
-
 Map of NUTS 3 areas in England by GVA per capita (2003).png 2,121 × 2,629; 553 KB
-
 Map of NUTS 3 areas in England by GVA per capita (2003).svg 2,121 × 2,629; 242 KB
-
 Map of NUTS 3 areas in England by GVA per capita (2004).png 2,121 × 2,629; 543 KB
-
 Map of NUTS 3 areas in England by GVA per capita (2004).svg 2,121 × 2,629; 242 KB
-
 Map of NUTS 3 areas in England by GVA per capita (2005).png 2,121 × 2,629; 534 KB
-
 Map of NUTS 3 areas in England by GVA per capita (2005).svg 2,121 × 2,629; 239 KB
-
 Map of NUTS 3 areas in England by GVA per capita (2006).png 2,121 × 2,629; 523 KB
-
 Map of NUTS 3 areas in England by GVA per capita (2006).svg 2,121 × 2,629; 246 KB
-
 Map of NUTS 3 areas in England by GVA per capita (2007).png 2,121 × 2,629; 514 KB
-
 Map of NUTS 3 areas in England by GVA per capita (2007).svg 2,121 × 2,629; 246 KB
-
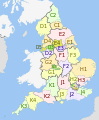
 NUTS 1 statistical regions of England map.svg 1,108 × 1,345; 373 KB
-
 NUTS 2 regions of England 2015 map.svg 1,108 × 1,345; 551 KB
-
 NUTS 3 regions of London 2015 map.svg 1,425 × 1,140; 927 KB
-
 NUTS 3 regions of London map.svg 1,425 × 1,140; 746 KB
-
 NUTS 3 regions of North East England map.svg 1,082 × 1,345; 714 KB
-
 NUTS 3 regions of North West England 2010 map.svg 674 × 1,345; 1.37 MB
-
 NUTS 3 regions of North West England 2015 map.svg 674 × 1,345; 1.3 MB
-
 NUTS 3 regions of North West England map.svg 674 × 1,345; 1.37 MB
-
 NUTS 3 regions of South East England 2015 map.svg 1,425 × 1,141; 1.5 MB
-
 NUTS 3 regions of South East England map.svg 1,425 × 1,141; 2.21 MB
-
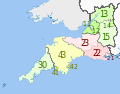 NUTS 3 regions of South West England map.svg 1,425 × 1,118; 1.81 MB
-
 NUTS 3 regions of the East Midlands 2010 map.svg 1,099 × 1,305; 1.64 MB
-
 NUTS 3 regions of the East Midlands map.svg 1,099 × 1,305; 1.63 MB
-
 NUTS 3 regions of the East of England 2010 map.svg 1,210 × 1,266; 2.17 MB
-
 NUTS 3 regions of the East of England 2015 map.svg 1,210 × 1,266; 2.34 MB
-
 NUTS 3 regions of the East of England map.svg 1,210 × 1,266; 2.17 MB
-
 NUTS 3 regions of the West Midlands 2010 map.svg 1,161 × 1,306; 1.36 MB
-
 NUTS 3 regions of the West Midlands map.svg 1,161 × 1,306; 1.36 MB
-
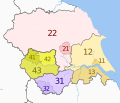
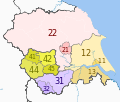 NUTS 3 regions of Yorkshire and the Humber 2010 map.svg 1,425 × 1,212; 1.24 MB
-
 NUTS 3 regions of Yorkshire and the Humber map.svg 1,425 × 1,212; 1.24 MB
.png)
.svg)
.png)
.svg)
.png)
.svg)
.png)
.svg)
.png)
.svg)
.png)
.svg)
.png)
.svg)
.png)
.svg)
.png)
.svg)
.png)
.svg)
.png)
.svg)
.png)
.svg)
.png)
.svg)


