Category:NOAA maps
Jump to navigation
Jump to search
Public domain maps obtained from the w:en:National Oceanic and Atmospheric Administration. Identify using {{PD-USGov-NOAA}}.
Subcategories
This category has the following 5 subcategories, out of 5 total.
Media in category "NOAA maps"
The following 59 files are in this category, out of 59 total.
-
16-008-NASA-2015RecordWarmGlobalYearSince1880-20160120 (120k-edited).png 400 × 225; 119 KB
-
16-008-NASA-2015RecordWarmGlobalYearSince1880-20160120.png 1,920 × 1,080; 2.22 MB
-
1cavg1 202310 Europe average temperatures.png 2,700 × 2,700; 838 KB
-
1cpcp1 202310 Europe total precipitation.png 2,700 × 2,700; 938 KB
-
1cpnp1 202310 Europe percent of normal precipitation.png 2,700 × 2,700; 1.12 MB
-
2008 age of ocean plates.png 2,560 × 1,346; 6.13 MB
-
BC-4 World Primary Network.jpg 1,780 × 1,176; 1.28 MB
-
North California Precipitations.gif 800 × 795; 50 KB
-
Catalonia relief location map.svg 2,776 × 2,488; 4.73 MB
-
Chagos large.png 1,311 × 1,947; 1.28 MB
-
Cortes Bank NOAA chart.PNG 552 × 305; 272 KB
-
Crozet Islands map-fr.svg 3,849 × 2,505; 1.99 MB
-
Crozet Islands relief location map.svg 1,924 × 1,670; 1.66 MB
-
February 1973 United States blizzard.jpg 1,051 × 808; 700 KB
-
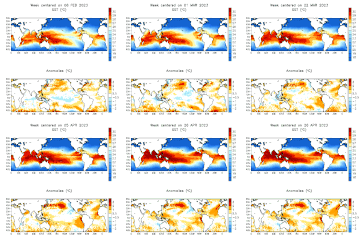
Gsstanim 20230208 20230426.gif 500 × 500; 906 KB
-
Gsstanim 20230412 20230628.gif 500 × 500; 844 KB
-
Gulf of Alaska seamounts.jpg 600 × 450; 34 KB
-
Hunga Tonga 2022 tsunami travel time.jpg 1,890 × 1,613; 410 KB
-
January 15, 2022 Tonga volcano-generated tsunami propagation.webm 1 min 11 s, 1,920 × 1,080; 17.15 MB
-
July 2022 Difference from average in CONUS.png 1,000 × 690; 179 KB
-
June 2022 Difference from average in CONUS.png 1,000 × 690; 180 KB
-
LAN Airport NOAA Sectional Chart 1935.png 325 × 260; 94 KB
-
Largest oil spills us waters NOAA.jpg 2,000 × 1,199; 352 KB
-
Limit of Oceans and Seas - 1st Edition - 1928.jpg 10,065 × 6,380; 26.11 MB
-
Limit of Oceans and Seas - 2nd Edition - 1st July 1937.jpg 9,968 × 7,888; 36.25 MB
-
Lux8June3000.gif 587 × 730; 43 KB
-
Map-blended-mntp-202309.png 990 × 765; 1.13 MB
-
Map-percentile-mntp-202301-202309.png 990 × 765; 1.15 MB
-
Map-percentile-mntp-202309 (1).png 990 × 765; 1.15 MB
-
NinetyEastRidge.jpg 506 × 676; 155 KB
-
NOAA Asuncion Island Benthic Map.png 922 × 908; 790 KB
-
NOAA Barbados reefs.jpg 1,269 × 1,933; 1.1 MB
-
NOAA map 18754 Newport Bay section1.jpg 743 × 535; 194 KB
-
NOAA map of Glacier Bay National Park.jpg 2,988 × 5,312; 3.35 MB
-
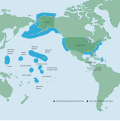
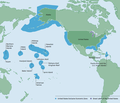
NOAA Map of the US EEZ.svg 612 × 613; 1.93 MB
-
NOAA33trk.JPG 1,453 × 2,002; 440 KB
-
Northeast Canyons and Seamounts Marine National Monument map NOAA.png 705 × 915; 540 KB
-
NOS Chart Catalog-Region 2.jpg 3,768 × 4,906; 918 KB
-
Overfished US stocks 2010.png 1,016 × 701; 287 KB
-
QuebecWildfires June12010.png 629 × 532; 303 KB
-
Saint-Paul and Amsterdam Islands map-fr.svg 2,330 × 2,597; 2.02 MB
-
Saint-Paul and Amsterdam Islands relief location map.svg 582 × 1,113; 1.86 MB
-
South Atlantic Anomaly.PNG 583 × 610; 87 KB
-
Southern California Precipitations.gif 960 × 745; 32 KB
-
Sstaanim 20230208 20230426.gif 500 × 300; 436 KB
-
Sstweek c 20230426.gif 641 × 828; 69 KB
-
Tafu-Maka.jpg 430 × 480; 89 KB
-
TCT and Doppler stations October 1 1977.gif 1,200 × 898; 575 KB
-
TCT surveys January 1 1967.jpg 650 × 409; 243 KB
-
Tsunami travel time Valdivia 1960.jpg 859 × 800; 324 KB
-
Turks and Caicos Islands NOAA coral reef map.jpg 1,930 × 1,269; 852 KB
-
US.EEZ Pacific centered NOAA map.png 754 × 647; 149 KB
-
W9 APB Stat map color.jpg 1,316 × 752; 80 KB
-
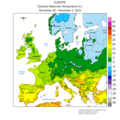
Wcmax1 20231126-20231202 Europe maximum temperatures.png 1,800 × 1,800; 400 KB
-
Wcmax9 20240505-20240511 Mexico maximum temperatures.png 1,700 × 1,360; 276 KB
-
Wcmin1 20231126-20231202 Europe minimum temperatures.png 1,800 × 1,800; 431 KB
-
Wcmin9 20240505-20240511 Mexico minimum temperatures.png 1,700 × 1,360; 280 KB
-
Wcpcp1 20231126-20231202 Europe total precipitation.png 2,700 × 2,700; 672 KB


