Category:Meteorology images that should use vector graphics
Jump to navigation
Jump to search
This is a subcategory of Category:Images that should use vector graphics. You can add images to this category using the template {{Convert to SVG|meteorology}}.
Media in category "Meteorology images that should use vector graphics"
The following 119 files are in this category, out of 119 total.
-
2002-12-01 Max-min Temperature Map NOAA.png 1,000 × 710; 28 KB
-
2009 Dust Storm - Australia and New Zealand Map.png 1,535 × 1,065; 542 KB
-
2010 13W forecast track.gif 1,120 × 784; 47 KB
-
2014 see flood map.png 1,000 × 692; 122 KB
-
2018-02-countries-bgc.png 3,509 × 2,481; 184 KB
-
7 zones dels ciclons tropicals.jpg 1,780 × 738; 273 KB
-
Africa Climate 14000bp.png 1,320 × 1,320; 124 KB
-
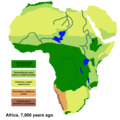
Africa Climate 7000bp.png 1,320 × 1,320; 210 KB
-
Africa Climate Today.png 1,320 × 1,320; 131 KB
-
Africa Köppen Map (cropped cutting off legend).png 1,500 × 1,566; 791 KB
-
Africa Köppen Map.png 1,500 × 1,816; 834 KB
-
Alisov's classification of climate ru.jpg 800 × 507; 108 KB
-
Alisov's classification of climate ua.jpg 800 × 507; 115 KB
-
Annual Average Temperature Map.jpg 1,100 × 849; 385 KB
-
Atlantic Ocean currents (Ocean currents 1943, cropped).png 416 × 246; 127 KB
-
AtmosphCircNT.png 300 × 264; 45 KB
-
Beta Gyre.png 507 × 518; 23 KB
-
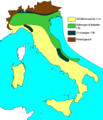
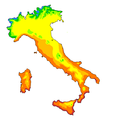
Carte climatique de l'Italie.PNG 541 × 632; 25 KB
-
China average annual precipitation (en).png 900 × 794; 270 KB
-
China snow 2008 eng.png 713 × 600; 98 KB
-
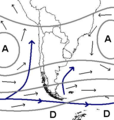
Clima de Chile fr.png 384 × 404; 96 KB
-
Clima de Chile.JPG 384 × 404; 30 KB
-
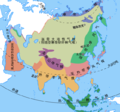
Climate maps of Asia.PNG 639 × 597; 139 KB
-
Climatemapusa2.PNG 701 × 565; 44 KB
-
ClimateMapWorld.png 727 × 470; 340 KB
-
Cloud types.jpg 850 × 400; 88 KB
-
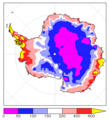
Dgv-surfbal.png 396 × 435; 11 KB
-
Diurnal tide types map.jpg 855 × 420; 125 KB
-
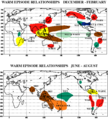
El Nino regional impacts.png 486 × 539; 23 KB
-
Enceladus "Cold geyser" Model.jpg 666 × 500; 37 KB
-
Enso-index-map.png 918 × 305; 8 KB
-
Fig4a ENSOindices Nino3.4only large.png 1,000 × 610; 63 KB
-
Flohn climate classification 1.png 554 × 333; 45 KB
-
Four-State Tornado Swarm.PNG 414 × 348; 9 KB
-
France climats carte 2010.png 1,685 × 2,050; 1.53 MB
-
Golfstrom Karte 2.png 649 × 544; 143 KB
-
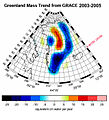
Greenland Ice Mass Trend.jpg 1,268 × 1,392; 613 KB
-
Greenland ice sheet thinning rate.jpg 253 × 430; 91 KB
-
Hot au.jpg 331 × 310; 38 KB
-
Hurr cross.jpg 544 × 297; 36 KB
-
Hurricane Rita's Path at Landfall.gif 856 × 679; 44 KB
-
Hurricane Sandy cumulative wind history 211847P sm.gif 896 × 716; 36 KB
-
Hurricane structure graphic.jpg 350 × 188; 20 KB
-
India-naturalhazards-map.png 350 × 427; 32 KB
-
Indian Ocean Gyre.png 681 × 624; 329 KB
-
Italia Clima Pinna.png 514 × 521; 10 KB
-
Japan glaciation.png 1,003 × 1,129; 248 KB
-
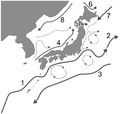
Japan's ocean currents.PNG 714 × 680; 65 KB
-
Jyu.png 4,237 × 2,804; 512 KB
-
Katrina FEMA declarations narrow.gif 470 × 350; 13 KB
-
Klima lissabon.png 500 × 346; 53 KB
-
Klimadiagramm-metrisch-deutsch-Duluth-USA.png 1,024 × 713; 111 KB
-
Klimagürtel-der-erde-tropen.png 3,600 × 1,800; 685 KB
-
Klimaregionen der Vereinigten Staaten.jpg 666 × 566; 169 KB
-
Klimasoner i Norge.png 793 × 1,123; 59 KB
-
Klimazonen-Prognose.gif 800 × 448; 390 KB
-
Koppen World Map Aw.png 4,231 × 2,592; 1.55 MB
-
Koppen World Map Cwa Cfa.png 4,231 × 2,592; 1.52 MB
-
KoppenclassificationworldmapCs.png 2,000 × 1,280; 98 KB
-
Köppen World Map High Resolution.png 12,047 × 7,383; 1.07 MB
-
Köppen-Geiger Climate Zones of Florida.pdf 1,275 × 1,650; 514 KB
-
La Nina regional impacts.gif 486 × 539; 22 KB
-
LaNina.png 696 × 624; 150 KB
-
Macrobian climatic zones.gif 200 × 200; 7 KB
-
Map local winds.png 1,425 × 625; 76 KB
-
Map prevailing winds on earth.png 1,425 × 625; 157 KB
-
Mapaclimapr.gif 634 × 420; 11 KB
-
Mean sst equatorial pacific.gif 432 × 645; 24 KB
-
MJO 5-day running mean through 1 Oct 2006.png 700 × 700; 15 KB
-
NCDC temperature trend.png 2,005 × 991; 2.18 MB
-
NinoRegions.png 696 × 318; 115 KB
-
North America Köppen Map.png 2,958 × 1,650; 1.19 MB
-
North Atlantic Gyre.png 748 × 539; 379 KB
-
North Pacific Gyre.png 980 × 570; 335 KB
-
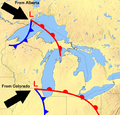
November gale.png 658 × 629; 626 KB
-
Ocean currents 1943 (borderless).png 2,577 × 1,306; 2.75 MB
-
Ocean currents 1943 (borderless)3.png 2,577 × 1,306; 2.41 MB
-
Outburststage.jpg 204 × 166; 5 KB
-
Philippine climate map.png 2,000 × 3,120; 204 KB
-
Pluviometria del Maresme.png 556 × 387; 16 KB
-
Precipitations.png 2,753 × 1,400; 101 KB
-
Radar-artefacts.PNG 700 × 321; 12 KB
-
Radar-artéfacts.png 868 × 631; 48 KB
-
Russia Köppen Map.png 1,860 × 575; 151 KB
-
Sacrobustos-Opusculum.png 800 × 816; 64 KB
-
Snowcsi-pt.png 1,000 × 678; 120 KB
-
Snowcsi.gif 993 × 671; 76 KB
-
South America Köppen Map.png 1,200 × 1,821; 642 KB
-
South Atlantic Gyre.png 674 × 534; 170 KB
-
South Pacific Gyre.png 1,002 × 520; 454 KB
-
Spain-climate-en.png 503 × 393; 160 KB
-
Spain-climate.png 503 × 393; 66 KB
-
Summer 1936 US Precipitation.gif 661 × 462; 413 KB
-
Summer 1936 US Temperature.gif 667 × 462; 417 KB
-
Sunshine.png 2,753 × 1,400; 267 KB
-
Super Outbreak Map.jpg 1,345 × 1,631; 2.46 MB
-
Supercell side view.jpg 1,280 × 931; 328 KB
-
TCMEXWarning92.JPG 112 × 126; 5 KB
-
Thermohaline Circulation 2.png 1,100 × 690; 122 KB
-
TorMay2004-Michigan.jpg 433 × 586; 35 KB
-
Trockenklimate.png 3,600 × 1,800; 647 KB
-
Tropical waves.jpg 2,374 × 944; 149 KB
-
Typical North Atlantic Tropical Cyclone Formation in September.png 450 × 227; 20 KB
-
Uk-cyclone-2.png 621 × 451; 67 KB
-
UK-Cyclone.gif 700 × 507; 52 KB
-
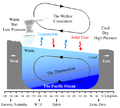
Walker-Zirkulation.png 1,141 × 262; 85 KB
-
Wasserkreislauf.png 1,033 × 490; 87 KB
-
West Asia Köppen Map.png 990 × 1,182; 511 KB
-
Western Australia-climate-map.png 417 × 694; 27 KB
-
Wind rose 2016 for PHLI Lihue Kauai, Hawaii.jpg 990 × 660; 62 KB
-
Wisconsin Rain 5 June to 13 June 2008.png 504 × 502; 13 KB
-
World Köppen Map.jpg 4,231 × 2,804; 1.25 MB
-
World Köppen Map.png 4,231 × 2,804; 1.05 MB
-
Климатични пояси.jpg 800 × 498; 112 KB
-
Типы климата Азербайджана.jpg 580 × 503; 37 KB
-
大氣環流.png 300 × 264; 48 KB
-
Convective Instability.png 636 × 662; 196 KB


