Category:Medical graphs
Jump to navigation
Jump to search
Subcategories
This category has the following 5 subcategories, out of 5 total.
Media in category "Medical graphs"
The following 68 files are in this category, out of 68 total.
-
1918 spanish flu waves.gif 600 × 308; 8 KB
-
19620220-JohnGlennEKG.jpg 435 × 103; 21 KB
-
1q21 1 schizophrenia autism DE.svg 527 × 185; 4 KB
-
2012 meningitis cases.svg 1,800 × 1,200; 12 KB
-
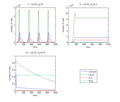
4 1tumor cells.png 560 × 420; 4 KB
-
Aclr-fr.svg 820 × 540; 41 KB
-
AMI Scotland.png 405 × 241; 8 KB
-
Area under curve.svg 744 × 654; 10 KB
-
AvgGrowthCurveMF.JPG 701 × 485; 23 KB
-
Base-metabol--ratio-mifflin-german.svg 512 × 320; 22 KB
-
Bifurcation4 3.png 560 × 420; 9 KB
-
Bisoprolol selectivity.svg 600 × 480; 7 KB
-
Blood nicotine graph.jpg 650 × 513; 77 KB
-
Breathing abnormalities (Polish).svg 744 × 1,052; 27 KB
-
Breathing abnormalities (Serbian).png 2,000 × 2,828; 370 KB
-
Breathing abnormalities.svg 744 × 1,052; 38 KB
-
Brustzentren 2009.gif 970 × 603; 12 KB
-
Cases of HPV cancers graphFr.png 893 × 612; 115 KB
-
Cheyne Stokes.png 1,862 × 1,012; 36 KB
-
Cheyne-Stokes-fr.jpg 1,069 × 677; 112 KB
-
Chowell2014 1918 influenza excess mortality in Spain by province.jpg 1,200 × 827; 210 KB
-
Cystine solubility in urine.png 1,662 × 918; 265 KB
-
D1s1 bifurcation.png 560 × 420; 10 KB
-
D1s2s1 solutions.png 1,280 × 678; 12 KB
-
Eat less do more.png 1,055 × 610; 107 KB
-
EHEC-HUS Tabelle.svg 1,024 × 428; 81 KB
-
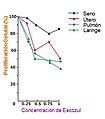
ESCOZUL.jpg 378 × 430; 33 KB
-
Fasen-van-hiv-infectie.png 915 × 457; 27 KB
-
Hemoglobin as protein and oxygen as ligand.png 888 × 572; 37 KB
-
HRQoL of people with ME-CFS.webp 421 × 729; 97 KB
-
Human Growth.png 420 × 283; 48 KB
-
Hydropathy Plot.jpg 640 × 512; 17 KB
-
Incidentie MG.jpg 709 × 496; 24 KB
-
Knoke1.jpg 980 × 774; 97 KB
-
Knoke2.jpg 1,048 × 850; 99 KB
-
Koerpertemperaturnacht.png 402 × 319; 3 KB
-
Koerpertemperaturnacht.svg 615 × 466; 12 KB
-
Live birth rates by TMSC.svg 255 × 165; 21 KB
-
Malaria fever.svg 1,296 × 536; 51 KB
-
Maleria Incidence.jpg 489 × 305; 27 KB
-
ME-CFS Papers by Year.svg 800 × 630; 45 KB
-
ME-CFS SF-36 functioning levels.svg 744 × 957; 39 KB
-
Method-of-pulse-wave-analisys.png 2,134 × 1,398; 231 KB
-
Normal values for peak expiratory flow - EU scale.svg 920 × 1,050; 79 KB
-
Post-exertional malaise in long Covid graph.jpg 1,519 × 755; 167 KB
-
Pouyette.png 500 × 300; 16 KB
-
PRC-Light+Mel no.png 323 × 342; 14 KB
-
PRC-Light+Mel.png 323 × 342; 3 KB
-
Pre-term corticosteroid data.svg 684 × 309; 95 KB
-
Prostate Cancer Risk Stratification.jpg 712 × 522; 96 KB
-
PSM V81 D310 Intragastric oscillations recorded by a pneumograph.png 1,006 × 913; 122 KB
-
PSM V81 D311 Intragastric oscillations of hunger recorded by a pneumograph.png 1,727 × 789; 132 KB
-
PSM V81 D311 Oscillations of the esophagus by a pneumograph.png 939 × 686; 65 KB
-
Relative levels of myocardial indicative enzymes.jpg 898 × 384; 171 KB
-
Reogram.jpg 1,556 × 538; 428 KB
-
S1 0s2 0withchemo.png 735 × 625; 9 KB
-
Spanische Grippe 1918 1919 GB.svg 512 × 266; 26 KB
-
Spanische Grippe vs Cov19 D GB.jpg 2,696 × 2,329; 1.12 MB
-
Spanische Grippe vs Cov19 GB.jpg 2,665 × 2,151; 1.12 MB
-
Success rates by amount of sperm.svg 255 × 165; 22 KB
-
Test Conconi esempio.svg 1,184 × 843; 177 KB
-
Thyroid Iodine Uptake Model.svg 1,500 × 875; 13 KB
-
Tilt table test showing POTS.webp 604 × 507; 23 KB
-
Tipus de Crohn.png 766 × 483; 31 KB
-
VASOTENS Registry workflow.png 780 × 540; 106 KB
-
VASOTENS Регистр - рабочая схема.png 780 × 540; 70 KB
-
Wikibook article pic.jpg 640 × 400; 17 KB
-
Метод анализа пульсовых волн.png 2,134 × 1,398; 214 KB


