Category:Matplotlib
Jump to navigation
Jump to search
comprehensive library for creating static, animated, and interactive visualizations in Python  | |||||
| Upload media | |||||
| Instance of |
| ||||
|---|---|---|---|---|---|
| Part of |
| ||||
| Creator |
| ||||
| Copyright license |
| ||||
| Has use | |||||
| Developer |
| ||||
| Platform | |||||
| Operating system | |||||
| Software version identifier |
| ||||
| Inception |
| ||||
| Publication date |
| ||||
| user manual URL | |||||
| official website | |||||
| |||||
Subcategories
This category has the following 4 subcategories, out of 4 total.
M
- Matplotlib icons (5 F)
Media in category "Matplotlib"
The following 44 files are in this category, out of 44 total.
-
 3D ábra.png 240 × 180; 23 KB
-
 Boxplot Europe heat flow vs Moho depth.png 2,705 × 1,943; 141 KB
-

-
 Circulation accordeon animation.gif 720 × 50; 381 KB
-
 Comparaison filtres median savitzky golay butterworth fft scipy.svg 900 × 540; 100 KB
-
 Comparaison filtres median savitzky golay scipy.svg 900 × 540; 48 KB
-
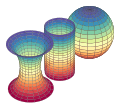 Constant gaussian curvature.svg 501 × 453; 568 KB
-
 Critère de Shannon.svg 731 × 551; 59 KB
-
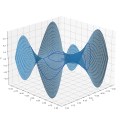 Curva sobre una superficie.svg 910 × 910; 4.97 MB
-
 Detection pics savitzky golay.svg 900 × 540; 33 KB
-
 Detection pics scipy signal find peaks.svg 900 × 540; 27 KB
-
 Differentiable neural computer.svg 649 × 284; 242 KB
-
 DNC training recall task.gif 919 × 459; 8.21 MB
-
 Exemple superposition de pics large et etroit.svg 900 × 540; 29 KB
-
 Graphe fct carre Python Matplotlib Jupyter.png 593 × 603; 50 KB
-
 Gravitational wave detection graph.png 3,123 × 1,668; 358 KB
-
 Görbék ábrázolása.png 270 × 180; 10 KB
-
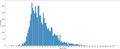
 Hisztogram.png 240 × 180; 3 KB
-
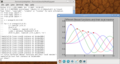
 IPython-6.x-screenshot-osx.png 1,622 × 1,088; 258 KB
-
 Körvonalas görbe.png 180 × 180; 21 KB
-
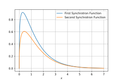
 Logarithmic-integral function.svg 576 × 432; 25 KB
-
 Logaritmikus spirál.png 180 × 180; 14 KB
-
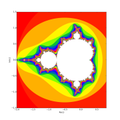 Mandelbrot plot.png 180 × 180; 17 KB
-
 Matplotlib screenshot.png 1,024 × 768; 161 KB
-
 Mpl example Rosenbrock function.svg 720 × 540; 1.21 MB
-
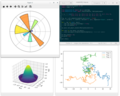 Mpl screenshot figures and code.png 1,227 × 978; 350 KB
-
 Napfoltok hőmérséklete.png 240 × 180; 23 KB
-
 Newton-Raphson method.gif 1,920 × 1,440; 1.1 MB
-
 Nomenclature figure python matplotlib fct trigo.svg 719 × 392; 89 KB
-
 NumPy Matplotlib sin x plotted with red dots.svg 576 × 432; 25 KB
-
 NumPyOptimizationSmall.png 930 × 494; 174 KB
-
Pi Calculation Confidence Visualization.webm 12 s, 1,670 × 842; 10.1 MB
-
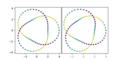
 Produit convolution carre cercle.svg 720 × 720; 44 KB
-
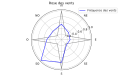 Rose des vents exemple Python.svg 540 × 360; 44 KB
-
 Rosenbrock függvény.png 240 × 180; 32 KB
-
 Scipy circular diffraction.png 1,280 × 800; 279 KB
-
 Seiyu age hist EN.png 1,754 × 710; 50 KB
-
 Seiyu age hist RU.png 1,752 × 705; 53 KB
-
 Szórás (2).png 240 × 180; 11 KB
-
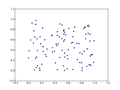 Szórás.png 240 × 180; 7 KB
-
 Trefoil 2D Stereogram.png 600 × 300; 43 KB
-
 Umbilic torus.png 11,755 × 7,370; 3.63 MB
-
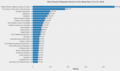 Wikipedia-Top 25 Report May 13 to 19, 2018.png 3,400 × 2,000; 408 KB
-
 Ábra.png 360 × 180; 55 KB


.png)


