Category:Market charts
Jump to navigation
Jump to search
Subcategories
This category has the following 2 subcategories, out of 2 total.
H
- Historical oil prices (68 F)
M
- Market Data Index on 20050726 (36 F)
Media in category "Market charts"
The following 68 files are in this category, out of 68 total.
-
 1477-1799 ESTC titles per decade, statistics.png 1,220 × 1,059; 25 KB
-
 1500-1700 English and German book markets compared.png 1,282 × 826; 15 KB
-
 1600-1799-estc-fiction.png 687 × 645; 37 KB
-
 1670-1709 English Term Catalogues, statistics.png 733 × 476; 26 KB
-
 1682-1731 Acta Eruditorum, Themenverteilung.png 972 × 577; 17 KB
-
 1682-1773 Acta Eruditorum, Themenverteilung.png 972 × 577; 16 KB
-
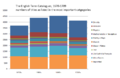
 1700 London's Book Market according to Term Catalogues.png 741 × 763; 52 KB
-

-

-
 2001 Numbers of Titles published in the UK.png 631 × 523; 34 KB
-
 2004 Format ml.svg 1,038 × 1,141; 4 KB
-
 2004 Format-bn.svg 1,038 × 1,161; 4 KB
-
 2004 Format-gu.svg 1,038 × 1,141; 4 KB
-
 2004 Format-mr.svg 1,038 × 1,141; 4 KB
-
 2004 Format-ta.svg 1,038 × 1,141; 3 KB
-
 2004 Format-te.svg 1,038 × 1,141; 3 KB
-
 2004 Format.svg 1,038 × 1,141; 4 KB
-
 2004Format.jpg 211 × 231; 22 KB
-
 2007-2009 Bear Market.png 605 × 350; 14 KB
-
 2008 UK Book Sales Value.png 611 × 497; 23 KB
-
 2008 UK Book Sales Value.svg 1,222 × 994; 117 KB
-
 2008 UK Book Sales Volume.png 669 × 503; 24 KB
-
 401k-historical-chart.jpg 576 × 395; 90 KB
-
 AktieEmitt.PNG 970 × 603; 25 KB
-
 Annual Income Growth by Income.png 800 × 600; 24 KB
-
 Awarded global commercial launch by market share.jpg 1,800 × 1,215; 143 KB
-
 Deutsche und englische Titel-Statistik, 1500-1699.png 1,173 × 699; 73 KB
-
 DeviationLKOHSIBN.jpg 634 × 225; 26 KB
-
 DeviationSigmaLKOHSIBN.jpg 638 × 356; 33 KB
-
 Doorbraak.png 772 × 375; 7 KB
-
 ESTC- and Termcatalogue-title numbers compared.png 1,143 × 797; 31 KB
-
 ESTC-Title-count-1600-1800.png 1,066 × 607; 26 KB
-
 Flashcrash-2016.PNG 387 × 279; 15 KB
-
 GeldvermAktie.PNG 970 × 603; 24 KB
-
 GlobalTrade wheat coarse grain soy 2008 usda.png 431 × 327; 5 KB
-
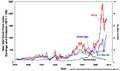
 IE Real SandP Prices, Earnings, and Dividends 1871-2006 - PT.png 1,024 × 608; 157 KB
-
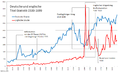
 IE Real SandP Prices, Earnings, and Dividends 1871-2006.png 1,081 × 642; 60 KB
-
 Investir en bourse.jpg 720 × 540; 35 KB
-
 Investir en bourse2.jpg 1,280 × 720; 116 KB
-
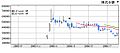 Jcom-1year.jpg 512 × 227; 36 KB
-
 Jcom1208.jpg 360 × 360; 70 KB
-
 Kursverlauf mit Regressionsgrade und Projection Bändern.JPG 416 × 243; 22 KB
-
 LeitzinsenDE (1999–2010).png 1,370 × 900; 13 KB
-
 LeitzinsenDE (1999–2013).png 1,370 × 900; 53 KB
-
 LKOHSIBNspread.jpg 634 × 512; 45 KB
-
 Market data on display at Taiwan Stock Exchange 20210208.jpg 2,048 × 1,299; 2.63 MB
-
 Marktanteil GPU 2012-2013.png 987 × 641; 8 KB
-
 Marktanteile Regionalzeitungen 2013.png 271 × 408; 47 KB
-
 Marktanteile Windenergie Deutschland.PNG 1,097 × 705; 48 KB
-
 Marktanteile Zeitschriften 2013.png 271 × 352; 45 KB
-
 Nasdaq Composite dot-com bubble.svg 500 × 280; 73 KB
-
 Price-volume-2008-crash Sberbank Gazprom.png 1,122 × 813; 46 KB
-
 Quote carrera.JPG 900 × 580; 47 KB
-
 S&P BSE SENSEX chart.svg 737 × 382; 182 KB
-
 Selected central bank rates.png 762 × 432; 121 KB
-
 SEMI and SEAJ book-to-bill ratios 2006-2012.svg 849 × 683; 48 KB
-
 Share of e-book market in 2017 by major publishing platforms.jpg 600 × 463; 113 KB
-
 SovCDS-rating de.svg 702 × 540; 155 KB
-
 Tesco Market Share.jpg 482 × 290; 105 KB
-
 TrendSMALKOHSIBN.jpg 628 × 168; 20 KB
-
 TSE 1st Section Trading volume(M Avg)(1972-).png 970 × 603; 4 KB
-
 TSE 1st Section Trading volume(M Avg)(1972-).svg 700 × 400; 26 KB
-
 VD16-VD17 Titel-Statistiken.png 981 × 711; 32 KB
-
 Volatility Bubble.png 1,096 × 438; 34 KB
-
 Wii-sales-rank-amazon.com-buy.com-holidays-2008.png 870 × 250; 25 KB
-
 Wii-used-available-amazon.com-holidays-2008.png 870 × 250; 20 KB
-
 World DRAM market share 2008Q1.PNG 560 × 575; 75 KB
-
 World Stock Chart 2009-2012.gif 972 × 800; 26 KB


.png)
.png)


(1972-).png)
(1972-).svg)


