Category:Maps showing 2010
Jump to navigation
Jump to search
| ← 2010 2011 2012 2013 2014 2015 2016 2017 2018 2019→ |
English: Maps showing the year 2010 (i.e. history maps)
See also category: 2010 maps. and 2010s maps for more maps showing this year usually created not long after the given year.
See also category: 2010 maps. and 2010s maps for more maps showing this year usually created not long after the given year.
Subcategories
This category has the following 2 subcategories, out of 2 total.
Media in category "Maps showing 2010"
The following 69 files are in this category, out of 69 total.
-
 2010 China HDI.png 900 × 794; 153 KB
-
 2010 US Census Hispanic map.svg 959 × 593; 128 KB
-
 Argentina provinces by population 2010.png 534 × 973; 34 KB
-
 Asian Americans 2010 County.png 7,750 × 4,650; 8.59 MB
-
 Auburn high campus map.png 570 × 454; 88 KB
-
 Automobil-Federal subjects of Russia 2010 svg.png 800 × 485; 90 KB
-
 BeekeepingTurkey2010.png 1,600 × 1,132; 247 KB
-
 Bevölkerungsdichte der DR Kongo.png 500 × 500; 50 KB
-
 Bevölkerungsdichte Landkreise.PNG 1,350 × 2,000; 531 KB
-
 BirthRate2010ua.PNG 571 × 434; 45 KB
-
 Black Americans 2010 County.png 15,610 × 8,900; 12.05 MB
-
 CaSom10.png 718 × 486; 19 KB
-
 Ceara DensidadePopulacional.svg 829 × 990; 254 KB
-
 Ceará DensidadePopulacional.svg 2,153 × 2,622; 1.75 MB
-
 Cuba-tourists-1.png 2,245 × 963; 552 KB
-
 Data availability precip update.png 760 × 449; 42 KB
-
 Death-rate-from-opioid-use-who,Africa,2010.svg 850 × 600; 145 KB
-
 Death-rate-from-opioid-use-who,Asia,2010.svg 850 × 600; 146 KB
-
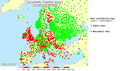
 Death-rate-from-opioid-use-who,Europe,2010.svg 850 × 600; 152 KB
-
 Death-rate-from-opioid-use-who,North America,2010.svg 850 × 600; 144 KB
-
 Death-rate-from-opioid-use-who,Oceania,2010.svg 850 × 600; 143 KB
-
 Death-rate-from-opioid-use-who,South America,2010.svg 850 × 600; 144 KB
-
 Death-rate-from-opioid-use-who,World,2010.svg 850 × 600; 152 KB
-
 Death-rate-smoking,Africa,2010.svg 850 × 699; 146 KB
-
 Death-rate-smoking,Asia,2010.svg 850 × 699; 146 KB
-
 Death-rate-smoking,Europe,2010.svg 850 × 699; 153 KB
-
 Death-rate-smoking,North America,2010.svg 850 × 699; 144 KB
-
 Death-rate-smoking,Oceania,2010.svg 850 × 699; 144 KB
-
 Death-rate-smoking,South America,2010.svg 850 × 699; 145 KB
-
 Death-rate-smoking,World,2010.svg 850 × 699; 153 KB
-
 Densidad de población 2010 (Argentina).jpg 616 × 659; 72 KB
-
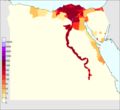 Egypt 2010 population density1.png 654 × 600; 75 KB
-
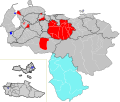 Elecciones regionales Venezuela 2010 resultados.svg 1,800 × 1,522; 1.1 MB
-
 Europa densidad alta velocidad.svg 1,150 × 800; 642 KB
-
 Extranjeros en Argentina por departamento, 2010.gif 325 × 605; 32 KB
-
 Extranjeros en Argentina por provincia, 2010.gif 360 × 600; 26 KB
-
 Gaza flotilla raid map-ar.svg 1,148 × 879; 629 KB
-
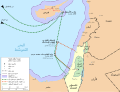
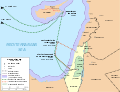 Gaza flotilla raid map.svg 1,148 × 879; 513 KB
-
 Gemeinden Thüringen Bevölkerungsdichte.png 3,480 × 2,920; 407 KB
-
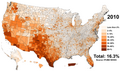 Hispanic Americans 2010 County.png 9,470 × 5,635; 11.49 MB
-
 Hotel de Blossac - 2010.svg 311 × 320; 237 KB
-
 Indonesia total fertility rate by province 2010.png 1,200 × 460; 170 KB
-
 Inmigrantes en Argentina por departamento - censo 2010.png 2,000 × 4,000; 945 KB
-
 Inmigrantes en Argentina por provincia - Censo 2010.png 2,000 × 4,280; 264 KB
-
 Karte IBA-Staedte LSA klein.jpg 300 × 422; 58 KB
-
 LatinAmericaGDPpercapita.png 350 × 425; 15 KB
-
 Mapa atentidos jun 2010.jpg 612 × 792; 284 KB
-
 Mapa de Colombia (tasa de mortalidad materna 2010).svg 1,420 × 1,896; 374 KB
-

-
 Mexico cartel map May 2010.svg 1,000 × 680; 193 KB
-
 Mexico State Population Density 2010.png 2,000 × 1,342; 229 KB
-
 Municipios Venezuela Densidad 2010.svg 1,800 × 1,522; 1.04 MB
-
 Nacionalidad mayoritaria de los inmigrantes en Argentina por provincia - Censo 2010.png 2,000 × 4,280; 307 KB
-
 Non-Hispanic White Americans 2010 County.png 15,610 × 8,900; 11.27 MB
-
 Olympic sites map 2010.jpg 8,259 × 8,862; 24.85 MB
-

-
 Paraguay population density.png 1,030 × 823; 51 KB
-
 Percentage of Russians by region.svg 1,092 × 630; 198 KB
-
 Politics in Latin-America.svg 1,000 × 1,250; 266 KB
-
-
 Porcentaje de extranjeros en el Gran Buenos Aires, 2010.gif 250 × 250; 15 KB
-
 PSUV map 2010.svg 2,005 × 1,520; 102 KB
-
 Russia GDP per capita by regions 2010 (current rubles).svg 512 × 240; 133 KB
-
 Shosholoza Meyl main stations 2010.svg 1,000 × 786; 540 KB
-
 Somalian Piracy Threat Map 2010.png 3,389 × 2,396; 2 MB
-
 StateAndProvinceOriginOfNHLPlayers2009-2010Season.svg 2,113 × 1,823; 1.78 MB
-
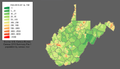 West Virginia population map.png 700 × 400; 107 KB
-
 White Americans 2010 County.png 15,610 × 8,900; 11.22 MB
-
 Worldfreedom2010.png 1,425 × 625; 211 KB


.jpg)


.svg)
_por_entidades_federativas_en_el_a%C3%B1o_2010.svg)


.gif)


.svg)


