Category:Maps of weather in 2018
Jump to navigation
Jump to search
Please sort by date, if specified
[[Maps of weather in 2018|MMDDhhmm]](in UTC)- take
*for complete year,MM-MMorMMDD-DDfor spans
Subcategories
This category has the following 4 subcategories, out of 4 total.
N
T
Media in category "Maps of weather in 2018"
The following 19 files are in this category, out of 19 total.
-
 Dürre 2018 Gesamtboden Deutschland.gif 663 × 795; 3.35 MB
-
 Dürre 2018 Oberboden Deutschland.gif 663 × 795; 3.33 MB
-
 Sh032018.18010506.gif 1,308 × 943; 69 KB
-
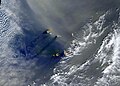
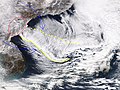 2018-01-23 Sea of Japan cold wave convergence zone by Aqua.jpg 3,600 × 2,700; 2.09 MB
-
 20180205 Sea of Japan cold wave turbulences by Aqua.jpg 4,801 × 3,600; 3.65 MB
-
 Hartmut Feb27.png 1,165 × 819; 1.66 MB
-
 Niña costera de 2018.png 453 × 501; 66 KB
-
 2018-03-01 Deutschland NASA Aqua-MODIS via Worldview.jpg 8,385 × 6,369; 5.59 MB
-
 2018-02-27-1736z A 48hrsfc.gif 1,200 × 764; 304 KB
-
 2018-03-06-0627z NOAA-20 dnb Riley-II (Yuliya).png 1,920 × 1,080; 2.45 MB
-
 2018-03-05-0538z A 48hrsfc.gif 1,200 × 764; 298 KB
-
 Islas de Cabo Verde.jpg 5,014 × 3,598; 3.29 MB
-
 Cabo Verde ESA395101.jpg 4,649 × 4,091; 13.29 MB
-

-
 US precip outlook winter 2018–19 NOAA.png 2,100 × 1,380; 818 KB
-
 US temp outlook winter 2018–19 NOAA.png 2,100 × 1,380; 736 KB
-

-
 NWS-NOAA Europe Percentage of Normal Precipitation DEC 30, 2018 - JAN 5, 2019.png 2,700 × 2,700; 230 KB
-
 Jan 02 2018 North American temperature map.png 515 × 424; 111 KB


.png)


