Category:Maps of weather and climate of Taiwan
Jump to navigation
Jump to search
Subcategories
This category has the following 2 subcategories, out of 2 total.
Media in category "Maps of weather and climate of Taiwan"
The following 15 files are in this category, out of 15 total.
-
 2016 snowfalls in Taiwan.svg 512 × 636; 1.02 MB
-
 20160124 snowfalls in Taiwan.png 2,840 × 3,530; 769 KB
-
 2020年8月3日中華民國自由地區累積雨量.jpg 880 × 880; 646 KB
-
 2024年颱風凱米登陸臺灣時的雷達合成回波圖.jpg 1,000 × 1,000; 350 KB
-
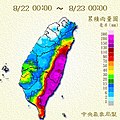 Hato Aug 22-23 2017 Precipitation Accumulated in Taiwan.JPG 400 × 400; 158 KB
-
 Khanun Oct 11-15 2017 Precipitation Accumulated in Taiwan.jpg 400 × 400; 152 KB
-
 Mangkhut Sep 15-16 2018 Precipitation Accumulated in Taiwan.jpg 400 × 400; 157 KB
-
 Meiyu Jun 03-04 2017 Precipitation Accumulated in Taiwan.jpg 400 × 400; 66 KB
-
 Nari Sept 15-19 2001 Precipitation Accumulated in Taiwan.JPG 1,680 × 2,373; 232 KB
-
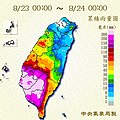
 Southwest Airflow Aug 28-29 2018 Precipitation Accumulated in Taiwan.jpg 400 × 400; 160 KB
-
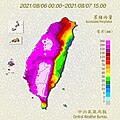 Southwest Airflow Aug 6-7 2021 Precipitation Accumulated in Taiwan.jpg 880 × 880; 237 KB
-
 Tracks of remarkable typhoons in Taiwan from 1897 to 1913.jpg 1,098 × 1,200; 257 KB
-
-
-
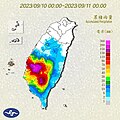
 WP172024 Precipitation Accumulated in Taiwan.jpg 880 × 880; 628 KB


