Category:Life expectancy charts for Poland
Jump to navigation
Jump to search
Media in category "Life expectancy charts for Poland"
The following 28 files are in this category, out of 28 total.
-
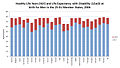
 Graph HLY 07.PNG 858 × 490; 81 KB
-
 Graph HLY 2005.jpg 803 × 500; 155 KB
-
 Graph HLY 2006.jpg 822 × 468; 117 KB
-
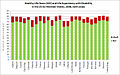
 Graph HLY 2007.png 840 × 470; 21 KB
-
 Graph HLY.jpg 805 × 503; 155 KB
-
 Healthy life expectancy bar chart -Europe -ru.png 1,724 × 593; 96 KB
-
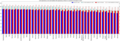
 Healthy life expectancy bar chart -Europe -sex -ru.png 1,724 × 593; 80 KB
-
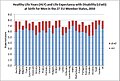
 Healthy life expectancy bar chart -Europe -sex.png 1,724 × 586; 73 KB
-
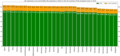
 Healthy life expectancy bar chart -Europe.png 1,724 × 586; 91 KB
-
 Healthy life expectancy bar chart -European Union -ru.png 1,249 × 592; 73 KB
-
 Healthy life expectancy bar chart -European Union -sex -ru.png 1,249 × 592; 62 KB
-
 Healthy life expectancy bar chart -European Union -sex.png 1,249 × 585; 55 KB
-
 Healthy life expectancy bar chart -European Union.png 1,249 × 585; 66 KB
-
 HLY 2009.jpg 519 × 350; 59 KB
-
 HLY 2009.png 726 × 259; 22 KB
-
 Hly 2009.png 745 × 283; 54 KB
-
 HLY 2010.jpg 519 × 350; 60 KB
-
 HLY08.JPG 907 × 464; 69 KB
-
 Life expectancy at birth in Poland, 1960–2022.png 1,623 × 863; 78 KB
-
 Life expectancy by WBG -Poland -diff -ru.png 1,153 × 721; 104 KB
-
 Life expectancy by WBG -Poland -diff.png 1,153 × 721; 99 KB
-
 Life expectancy by WBG -Poland -ru.png 1,162 × 607; 85 KB
-
 Life expectancy by WBG -Poland.png 1,162 × 607; 80 KB
-
 Life expectancy in the largest European countries -ru.png 1,386 × 880; 207 KB
-
 Life expectancy in the largest European countries.png 1,386 × 880; 200 KB
-
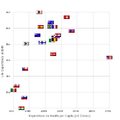 Life expectancy vs spending OECD.png 500 × 500; 9 KB
-
 Life expectancy.gif 572 × 401; 5 KB
-
 Life expectancy.png 2,705 × 1,708; 110 KB


