Category:Libertarian Party presidential graphs (United States)
Jump to navigation
Jump to search
Media in category "Libertarian Party presidential graphs (United States)"
The following 20 files are in this category, out of 20 total.
-
 Libertarian Presidential Election Results 1972-2008.png 732 × 454; 42 KB
-
 Libertarian Presidential Election Results.png 393 × 436; 12 KB
-
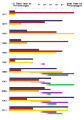
 United States presidential election ordinal results bar graph (Expanded).png 9,000 × 3,600; 194 KB
-
 United States presidential election ordinal results bar graph.png 5,000 × 3,600; 138 KB
-
 United States presidential election ordinal results line graph (Expanded).png 4,657 × 3,600; 356 KB
-
 United States presidential election ordinal results line graph.png 4,657 × 3,600; 207 KB
-
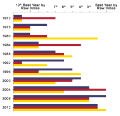
 United States presidential election raw popular vote count bar graph (Expanded).png 9,450 × 11,500; 578 KB
-
 United States presidential election raw popular vote count bar graph.png 5,450 × 11,500; 389 KB
-
 United States presidential election raw popular vote count line graph (Expanded).png 5,107 × 11,500; 732 KB
-
 United States presidential election raw popular vote count line graph.png 5,107 × 11,500; 642 KB
-
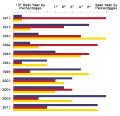
 United States presidential election results bar graph (Expanded).png 9,000 × 7,000; 318 KB
-
 United States presidential election results bar graph.png 5,000 × 7,000; 207 KB
-
 United States presidential election results line graph (Expanded).png 4,657 × 7,000; 507 KB
-
 United States presidential election results line graph.png 4,657 × 7,000; 443 KB
-

-

-
-
-

-


.png)

.png)

.png)

.png)

.png)


.png)

.png)

.png)
.png)