Category:Interpolation
Jump to navigation
Jump to search
English: Category for interpolation images.
method for constructing new data points between known data points | |||||
| Upload media | |||||
| Instance of | |||||
|---|---|---|---|---|---|
| Subclass of | |||||
| Different from | |||||
| |||||
Subcategories
This category has the following 10 subcategories, out of 10 total.
3
- 3D interpolation (3 F)
B
- Bilinear interpolation (20 F)
C
- Color interpolations (15 F)
I
L
- Lagrange polynomial (13 F)
S
- Shading interpolation (7 F)
V
- Videos of interpolation (1 F)
Pages in category "Interpolation"
This category contains only the following page.
Media in category "Interpolation"
The following 188 files are in this category, out of 188 total.
-
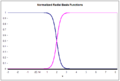 060803 normalized radial basis functions.png 700 × 472; 4 KB
-
 060804 4 normalized basis functions.png 700 × 472; 7 KB
-
 1D linear interpolation.jpg 372 × 142; 11 KB
-
 3 polynomials of degree 2 through 2 points.svg 200 × 200; 1 KB
-
 Artificial Neural Network Example.png 3,840 × 2,880; 292 KB
-
 Bed of nails.png 427 × 371; 23 KB
-
 Beispiel Bikubische C2 Interpolation.png 959 × 346; 153 KB
-
 Bild2 Sinus1 mit Punkten.png 1,466 × 796; 227 KB
-
 Bild3 Polynom1 mit Punkten.png 1,821 × 746; 368 KB
-
 Bild4 Sinus2 von Hand.png 1,056 × 318; 179 KB
-
 Bild5 Polynomfunktion von Hand.png 866 × 352; 118 KB
-
 Bump function shape.png 409 × 371; 34 KB
-
 Calc-Funktion in Geogebra.png 648 × 473; 30 KB
-
 Cell indexing.svg 1,188 × 620; 4 KB
-
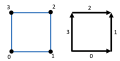 Cell indexing2.svg 1,188 × 596; 185 KB
-
 Comparaison interpolation scipy interpolate polynomes.svg 1,800 × 1,080; 38 KB
-
 Comparison 2.jpg 1,305 × 1,022; 98 KB
-
 Comparison of 1D and 2D interpolation es.svg 512 × 341; 8 KB
-
 Comparison of 1D and 2D interpolation-ru.svg 737 × 415; 16 KB
-
 Comparison of 1D and 2D interpolation.svg 512 × 341; 8 KB
-
 Comparison1.jpg 1,280 × 998; 106 KB
-
 Cubic interpolation visualisation.svg 512 × 683; 5 KB
-
 Cubic spline 1D interpolation.svg 720 × 720; 21 KB
-
 Cubic-Spline.jpg 826 × 498; 135 KB
-
De-Interpolation.ogg 2.4 s; 24 KB
-
De-interpolieren.ogg 2.3 s; 23 KB
-
 DeRhamComplexInterpolation.svg 1,583 × 395; 136 KB
-
 Desarrollo-moda.jpg 1,470 × 458; 49 KB
-
 Df plot.png 800 × 600; 22 KB
-
 Diagrama de flujo de factorial.xcf 478 × 447; 81 KB
-
Different Samle Rates At Different Interpolations Comparison.wav 1 min 11 s; 1.5 MB
-
 Direct skip.jpg 710 × 261; 17 KB
-
 Diskrete Werte interpolieren.jpg 692 × 152; 60 KB
-
 Edge of ill-conditioning.png 432 × 400; 15 KB
-
 Element interpolation.PNG 362 × 228; 11 KB
-
 Enclosing points.PNG 230 × 199; 3 KB
-
 Enclosing points.svg 318 × 270; 1 KB
-
 Enclosing points2.svg 230 × 203; 28 KB
-
 Example of kriging interpolation in 1D.png 885 × 524; 11 KB
-
 Excel-Funktion in Geogebra.png 727 × 504; 36 KB
-
 F plot.png 800 × 600; 24 KB
-
 Face interpolation2.PNG 342 × 223; 11 KB
-
 Face interpolation3.PNG 343 × 231; 11 KB
-
 Factorial interpolation.png 424 × 308; 11 KB
-
 Fehlerkorrekturmodell BSP Residuen.jpg 626 × 357; 48 KB
-
 Finite difference spline example.png 894 × 623; 2 KB
-
 Font interpolation.png 1,509 × 611; 49 KB
-
 Frame rate doubling.jpg 482 × 191; 21 KB
-
 Fórmula de Interpolación con 3 Pares de Valores Tabulares.png 836 × 531; 27 KB
-
 Geogebra splines.png 1,002 × 683; 143 KB
-
 GibbsXspline.png 842 × 595; 6 KB
-
 Graphe epsilon algorithme d'interpolation de la fonction logarithme.svg 1,074 × 840; 43 KB
-
 Hermite interpolation.svg 694 × 694; 40 KB
-
 Hermite's interpolation.png 694 × 428; 5 KB
-
 HermiteInterpolationSine3P.png 400 × 400; 15 KB
-
 HermiteInterpolationSine4P.png 400 × 400; 14 KB
-
 HermitovyPolyn.gif 429 × 298; 13 KB
-
 Ideal interpolator filter (frequency).png 145 × 140; 657 bytes
-
 Ideal interpolator filter (time).png 237 × 143; 2 KB
-
 Image-before-scaling+white border.png 200 × 73; 4 KB
-
 Inkscape interpolate.svg 3,194 × 935; 18 KB
-
Interframe motion interpolation.webm 40 s, 800 × 450; 736 KB
-
 Interp-l1.svg 243 × 358; 120 KB
-
 Interpolación lineal.svg 800 × 800; 25 KB
-
 Interpolación por Lagrange.png 827 × 447; 15 KB
-
 Interpolacja wartości.jpeg 288 × 219; 11 KB
-
 Interpolacja.svg 600 × 480; 10 KB
-
LL-Q150 (fra)-WikiLucas00-interpolation.wav 1.5 s; 139 KB
-
 Interpolation 1.jpg 592 × 690; 29 KB
-
 Interpolation 2.jpg 552 × 121; 8 KB
-
 Interpolation constante interpolate interp1d nearest et zero.svg 540 × 360; 64 KB
-
 Interpolation Data.svg 600 × 480; 6 KB
-
 Interpolation der Runge-Funktion (n=5).svg 567 × 354; 11 KB
-
 Interpolation der Tangensfunktion.svg 567 × 354; 9 KB
-
 Interpolation example linear.svg 600 × 480; 5 KB
-
 Interpolation example polynomial.png 252 × 261; 2 KB
-
 Interpolation example polynomial.svg 600 × 480; 13 KB
-
 Interpolation example spline.svg 600 × 480; 13 KB
-
 Interpolation KEF-Wachstum 1. Halbjahr.png 798 × 563; 34 KB
-
 Interpolation KEF-Wachstum 2. Halbjahr.png 990 × 535; 48 KB
-
 Interpolation KEF-Wachstumsrate über das gesamte Jahr.png 811 × 518; 39 KB
-
 Interpolation lineaire numpy interp trois extrapolations.svg 720 × 720; 53 KB
-
 INTERPOLATION LINEAIRE.pdf 1,239 × 1,752; 48 KB
-
 Interpolation lines - comparison.png 350 × 200; 3 KB
-
 Interpolation runge funktion 10 stuetzstellen.png 1,201 × 900; 14 KB
-
 Interpolation runge funktion 5 stuetzstellen.png 1,201 × 900; 14 KB
-
 Interpolation Test-1a.jpg 800 × 800; 138 KB
-
 Interpolation Test-1b.jpg 800 × 800; 199 KB
-
 Interpolation Test-2a.jpg 800 × 800; 138 KB
-
 Interpolation Test-2b.jpg 800 × 800; 201 KB
-
 Interpolation trois types.svg 540 × 360; 59 KB
-
 Interpolation value.png 253 × 224; 4 KB
-
 Interpolation-relevanter-Gitterpunkte-2.svg 901 × 575; 11 KB
-
 Interpolation-relevanter-Gitterpunkte.svg 796 × 541; 37 KB
-
 Interpolation.png 698 × 577; 8 KB
-
 Interpolation3DCube-1.gif 463 × 387; 8 KB
-
 Interpolation3DCube-1.jpg 729 × 603; 33 KB
-
InterpolationHarmonics.wav 1 min 29 s; 1.87 MB
-
 InterpolationSearch100.png 561 × 420; 6 KB
-
 InterpolationSearch12.png 561 × 420; 6 KB
-
 InterpolationSearch12exp.png 561 × 420; 6 KB
-
 InterpolationSearch360.png 561 × 420; 6 KB
-
 InterpolationSearchParabolas.png 561 × 420; 5 KB
-
 InterpolationSearchQuadratic.png 561 × 420; 6 KB
-
 Interpolazio 2016.pdf 900 × 900; 5 KB
-
 Interpolazione grafica.jpg 800 × 600; 16 KB
-
 Interpolazione-Spline-IAC-anni-30.jpg 2,030 × 1,065; 215 KB
-
 InterpolazioneSpline.png 842 × 595; 6 KB
-
 Interpoláció.gif 569 × 200; 5 KB
-
 Inverse Distance Weighting.png 1,367 × 573; 151 KB
-
 Kuantil kalkulurako diagrama hutsa.png 480 × 480; 2 KB
-
 Kuantilhist eu.svg 1,125 × 750; 33 KB
-
 Lagrange polynomials for continuations of sequence 1,2,3.gif 1,649 × 959; 67 KB
-
 Lagrange-interpoláció.png 545 × 418; 15 KB
-
 Lagrangesche Basisfunktionen.svg 512 × 377; 22 KB
-
 Lanczos interpolation - Sheet music, interpolated.jpg 535 × 248; 33 KB
-
 Lanczos interpolation - Sheet music, original.jpg 534 × 248; 53 KB
-
 Lanczos-r01-filtering.svg 720 × 320; 16 KB
-
 Lanczos-r02-filtering.svg 720 × 320; 17 KB
-
 Lanczos-r03-filtering.svg 720 × 320; 18 KB
-
 Lin interp w-legend.png 1,024 × 609; 24 KB
-
 Line-interpolation.png 258 × 236; 16 KB
-
 Linear interpolation 2.png 1,600 × 600; 88 KB
-
 Linear interpolation of J0 (basis set).svg 719 × 444; 82 KB
-
 Linear interpolation of J1 (basis set).svg 719 × 444; 63 KB
-
 Linear interpolation with pixels.png 406 × 60; 1 KB
-
 Linear interpolation.png 310 × 319; 7 KB
-
 Linear interpolation.svg 590 × 195; 7 KB
-
 LinearInterpolation.svg 150 × 150; 1 KB
-
 Lineáris interpoláció.png 546 × 409; 16 KB
-
 Lozenge Diagram.svg 497 × 603; 57 KB
-
 Mediana 0001.png 480 × 480; 3 KB
-
 Medianahist.svg 1,125 × 750; 32 KB
-
 Moving Least Squares.png 481 × 384; 7 KB
-
 Moving Least Squares2.png 560 × 420; 8 KB
-
 MyNurbs Points.JPG 1,184 × 832; 123 KB
-
 Myplot p2.svg 567 × 354; 12 KB
-
 Natural-neighbors-coefficients-example.png 318 × 255; 25 KB
-
 Natural-neighbors-coefficients-Laplace-example.png 318 × 255; 19 KB
-
 Newton method.png 942 × 351; 76 KB
-
 Normalized radial basis functions.svg 460 × 422; 2 KB
-
 Overfitted Data.png 377 × 256; 14 KB
-
 Padua points fam 1 degree 5.png 1,537 × 1,537; 163 KB
-
 Padua points fam 1 degree 6.png 1,537 × 1,537; 181 KB
-
 Piecewise constant.png 249 × 257; 1 KB
-
 Piecewise constant.svg 600 × 480; 5 KB
-
 Polynominterpolation Schema von Neville.jpg 650 × 192; 23 KB
-
 Prediction error.PNG 644 × 738; 4 KB
-
 PrunedRadialInterpolation.jpg 1,174 × 487; 51 KB
-
 Punkte Interpolation.png 448 × 173; 4 KB
-
 Punkte Interpolation.svg 590 × 194; 2 KB
-
 Quadratic interpolation.svg 752 × 564; 105 KB
-
 Quasilinearexample.png 1,120 × 840; 23 KB
-
 Radial Basis Function Interpolation.svg 720 × 496; 82 KB
-
 Radial funktion network.svg 465 × 390; 8 KB
-
 RadialInterpolationNonPruned.jpg 1,207 × 807; 98 KB
-
 RadialInterpolationSubCubeGeneration.jpg 733 × 603; 46 KB
-
 Raised cosine filter.png 427 × 209; 1 KB
-
 Recursive Linear Interpolation.svg 568 × 160; 3 KB
-
 Resize Catmull-Rom.png 512 × 256; 177 KB
-
 Resize Cubic B-Spline.png 512 × 256; 144 KB
-
 Resize nearest neighbor.png 512 × 256; 52 KB
-
 Rooftop basis function for MoM.png 1,773 × 722; 90 KB
-
 Runge cheby error.jpg 560 × 420; 31 KB
-
 Runge equi error.jpg 560 × 420; 42 KB
-
 Runge phenomenon equidist chebushev.gif 618 × 461; 128 KB
-
 Runge phenomenon.svg 720 × 720; 24 KB
-
 Runge's phenomenon in Lagrange polynomials.svg 719 × 491; 73 KB
-
 Runge01.svg 744 × 1,052; 20 KB
-
 Rungesphenomenon.png 700 × 664; 47 KB
-
 Shepard interpolation 1 dimension.png 1,152 × 462; 38 KB
-
 Shepard interpolation 2.png 640 × 160; 24 KB
-
 Shepard interpolation.png 640 × 160; 19 KB
-
 Splined epitrochoid.png 400 × 400; 27 KB
-
 Splined epitrochoid.svg 369 × 363; 51 KB
-
 Subpel interpolation.jpg 725 × 262; 16 KB
-

-
 Teoría de los Eclipses - Interpolación por Diferencias.png 1,293 × 568; 40 KB
-
 Trilinear interpolation visualisation.svg 512 × 683; 8 KB
-
 Umbrella Nearest Neigbor.png 179 × 151; 10 KB
-
 Unnormalized radial basis functions.svg 460 × 422; 2 KB
-
 Vergleich von linearem (Spline-) Interpolation Fit.png 779 × 494; 12 KB
-
 Vmath 5.png 570 × 63; 23 KB
-
 VR Bloc-diagramme topographie.tif 708 × 695; 89 KB
-
 VR Méandres de la Seine.tif 1,062 × 708; 265 KB
-
 VR Panoplie de quatre représentations graphiques du même objet.tif 4,488 × 1,328; 708 KB
-
 VR vraies valeurs et interpolations.gif 1,092 × 561; 83 KB
-
 ZOHBands.png 400 × 768; 62 KB


.png)
.png)


.svg)


.svg)
.svg)


_Interpolation_Fit.png)

