Category:Images with Python source code
Jump to navigation
Jump to search
Subcategories
This category has the following 6 subcategories, out of 6 total.
Pages in category "Images with Python source code"
This category contains only the following page.
Media in category "Images with Python source code"
The following 200 files are in this category, out of 224 total.
(previous page) (next page)-
 1-bit grayscale.gif 400 × 400; 167 KB
-
 2 example.svg 736 × 496; 101 KB
-
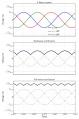 3 phase rectification 2.svg 624 × 943; 120 KB
-
 725 Julia sets.png 1,856 × 1,600; 1.13 MB
-
 8-bit grayscale.gif 400 × 400; 229 KB
-
 9-bit RGB Cube.gif 400 × 400; 3.52 MB
-

-
 Advection equation solution comparison.png 2,425 × 2,282; 360 KB
-
 Ageev 5X circle graph.svg 1,025 × 1,025; 10 KB
-
 Airydisk linear.png 600 × 600; 10 KB
-
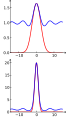
 Airydisks rayleigh sqrt.png 400 × 400; 16 KB
-
 AliasingSines.svg 675 × 225; 2 KB
-
 Amplitude & phase vs frequency for 3-term boxcar filter.svg 435 × 400; 20 KB
-
 Amplitude modulation.svg 585 × 441; 43 KB
-
 Archimedean spiral polar.svg 609 × 618; 91 KB
-
 Arnold's Cat Map animation (74px).gif 74 × 74; 2.29 MB
-
 Arnold's Cat Map animation (74px, zoomed, labelled).gif 224 × 263; 1.95 MB
-
 Atan diagram.svg 575 × 449; 204 KB
-
 Barabasi Albert model.gif 800 × 800; 255 KB
-
 Barnes-Hut tree construction.png 300 × 300; 9 KB
-
 Barnsley fern 1024x1024.png 1,024 × 1,024; 311 KB
-
 Bartl.png 1,500 × 1,000; 49 KB
-
 Beta distribution cdf.svg 566 × 425; 80 KB
-
 Beta distribution pdf.svg 531 × 425; 80 KB
-
 Beta-skeleton.svg 450 × 450; 78 KB
-
 Bezier curves composition ray-traced in 3D.png 1,936 × 1,936; 3.52 MB
-
 Binary logarithm plot with ticks.svg 408 × 325; 56 KB
-
 Birthday paradox.svg 575 × 291; 188 KB
-
 Blancmange.svg 600 × 400; 103 KB
-
 BlochWaves1D.svg 540 × 450; 75 KB
-
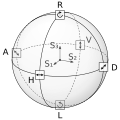
 BMonSphere.jpg 365 × 356; 10 KB
-
 Bsa-religion-question-1983-2005.svg 862 × 551; 35 KB
-
 Campania il NW alpha.png 1,201 × 1,201; 682 KB
-
 Campania map height.png 1,201 × 1,201; 417 KB
-
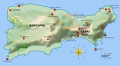 Capri sights terrain.svg 512 × 282; 757 KB
-
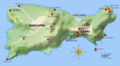 Capri sights.png 2,000 × 1,100; 1.05 MB
-
 Catenary animation.gif 150 × 80; 75 KB
-
 Catenary properties.svg 520 × 396; 3 KB
-
 Cauchy sequence illustration.svg 305 × 170; 50 KB
-
 ChildLangmuirLawGraph1.svg 360 × 360; 16 KB
-
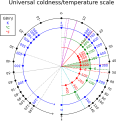 ColdnessScale.svg 312 × 324; 76 KB
-
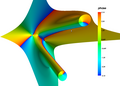 ColorComplexPlot3D.png 1,222 × 880; 235 KB
-
 Composition in 3D generated with the opensimplex noise.png 1,504 × 2,160; 3.3 MB
-
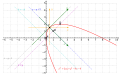 Conic x^2+2xy+y^2−8x=0.svg 743 × 470; 98 KB
-
 Correlation significance.svg 360 × 305; 35 KB
-
 Cosmos-animation Bouncing.gif 220 × 160; 289 KB
-
 Cosmos-animation De-Sitter.gif 220 × 160; 376 KB
-
 Cosmos-animation Einstein-De-Sitter.gif 220 × 160; 172 KB
-
 Cosmos-animation Empty.gif 220 × 160; 134 KB
-
 Cosmos-animation Friedmann-closed.gif 220 × 160; 170 KB
-
 Cosmos-animation Friedmann-open.gif 220 × 160; 143 KB
-
 Cosmos-animation Friedmann-radiation.gif 220 × 160; 101 KB
-
 Cosmos-animation Lambda-CDM.gif 220 × 160; 169 KB
-
 Cosmos-animation Static.gif 220 × 160; 6 KB
-
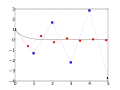
 Curve fitting.svg 512 × 384; 23 KB
-
 Cylindrical magnet.svg 616 × 216; 2 KB
-
 Damped Oscillation2.svg 444 × 386; 70 KB
-
 Desert planet that is orbiting brown dwarf star 1 1 1 1.png 1,600 × 1,200; 528 KB
-
 Dft visualization rev2 n0008 trimmed.svg 1,246 × 1,260; 500 KB
-
 Diagram of the real branches of the Lambert W function.png 800 × 600; 23 KB
-
 Dirichlet process draws.svg 900 × 900; 588 KB
-
 Domain coloring x2-1 x-2-i x-2-i d x2+2+2i.xcf 2,000 × 2,000; 15.09 MB
-
 Domain coloring z 01.xcf 512 × 512; 1.1 MB
-
 Domain coloring.png 536 × 534; 530 KB
-
 Earthquakes by month in Italy.png 812 × 612; 24 KB
-
-
 Edit rates by users and bots on wikimedia Commons July1 July27 2012.png 2,400 × 1,230; 663 KB
-
 Ehrenfest-paradox-disk.svg 220 × 180; 4 KB
-
 Electron asymmetric motion animation.gif 300 × 150; 131 KB
-
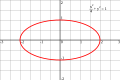 Ellipse in coordinate system with semi-axes labelled.svg 512 × 341; 2 KB
-
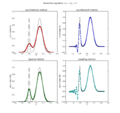
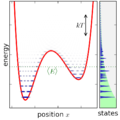
 Ensemble classical 1DOF canonical.png 900 × 1,350; 174 KB
-
 Ensemble quantum 1DOF canonical.png 900 × 900; 78 KB
-
 Epicycloid2 vectorial.svg 720 × 540; 297 KB
-
 EulerPhi.svg 731 × 551; 232 KB
-
 Evolution number articles WP-fr.svg 576 × 432; 46 KB
-
 Expinvsq5.svg 720 × 540; 19 KB
-
 FD e mu.svg 354 × 353; 62 KB
-
 FD kT e.svg 358 × 363; 49 KB
-
 Fibonacci word fractal, order 18.svg 826 × 1,979; 621 KB
-
 Field tidal.svg 1,123 × 608; 18 KB
-
 Fitzhugh-nagumo b = 0.8.gif 1,600 × 1,600; 52.64 MB
-
 Fitzhugh-nagumo b = 1.25.gif 1,600 × 1,600; 56.48 MB
-
 Fitzhugh-nagumo b = 2.0, separatrix.png 1,260 × 1,297; 958 KB
-
 Fitzhugh-nagumo b = 2.0.gif 1,600 × 1,600; 63.72 MB
-
 Fourier31.gif 812 × 612; 212 KB
-
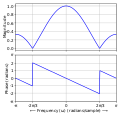 Frequency response of 3-term boxcar filter.svg 416 × 400; 20 KB
-
 Gabriel graph.svg 600 × 600; 63 KB
-
 Gaussian-beam-animation.gif 320 × 200; 381 KB
-
 Gaussianbeam fieldamplitude bw.png 600 × 300; 30 KB
-
 Gaussianbeam fieldamplitude grey.png 600 × 300; 30 KB
-
 Gaussianbeam fieldamplitude wb.png 600 × 300; 24 KB
-
 Gaussianbeam intensity bw.png 600 × 300; 6 KB
-
 Gaussianbeam intensity wb.png 600 × 300; 6 KB
-
 Gaussianbeam travelling grey.gif 240 × 140; 231 KB
-
 Gaussianbeam travelling PRGn.gif 240 × 140; 335 KB
-
 Gray configuration.svg 368 × 374; 13 KB
-
 Hamiltonian flow classical.gif 195 × 390; 172 KB
-
 Heat cylinder.gif 1,200 × 954; 2.84 MB
-
 Heat smiley.gif 1,200 × 954; 4.69 MB
-
 Heat.gif 1,200 × 954; 2.66 MB
-
 Helmholtz coil, B magnitude cross section.svg 540 × 540; 250 KB
-
 Hermite-gaussian.png 1,280 × 960; 120 KB
-
 Heteroclinic orbit in pendulum phaseportrait.png 1,017 × 529; 15 KB
-
 Himmelblau function.svg 720 × 540; 5.01 MB
-
 Hyperbolic and exponential; cosh.svg 389 × 530; 72 KB
-
 Hyperbolic and exponential; sinh.svg 319 × 503; 66 KB
-
 Hyperbolic flow example, illustrating stable and unstable manifolds.png 692 × 665; 309 KB
-
 Ideal gas isotherms.svg 305 × 314; 31 KB
-
 Instability of Euler's method.svg 720 × 540; 23 KB
-
 Interpolation-bicubic.svg 450 × 450; 74 KB
-
 Inverse transform sampling.png 382 × 378; 23 KB
-
 JPEG example subimage - equalized.svg 400 × 400; 3 KB
-
 Karmarkar.svg 720 × 540; 43 KB
-
 KruskalDemo.gif 314 × 323; 415 KB
-
 Laguerre-gaussian.png 1,280 × 960; 166 KB
-
 Laplaces method.svg 263 × 475; 24 KB
-
 Levy0 distributionPDF.svg 413 × 419; 51 KB
-
 Levy0 LdistributionPDF.svg 484 × 428; 82 KB
-
 Line pixel subpixel aa.gif 384 × 128; 95 KB
-
 Linear least squares example2.svg 279 × 274; 50 KB
-
 Logarithm derivative.svg 375 × 243; 44 KB
-
 Logarithmic spiral (1).svg 582 × 582; 840 bytes
-
 Logistic cdf.svg 450 × 360; 39 KB
-
 Logisticpdfunction.svg 450 × 360; 40 KB
-
 Logit.svg 430 × 280; 4 KB
-
 Lorentz Transform Animation.gif 256 × 256; 232 KB
-
 Mandelbrot numpy set 1.png 2,560 × 1,920; 1.04 MB
-
 Mandelbrot numpy set 2.png 2,560 × 960; 927 KB
-
 Mandelbrot numpy set 3.png 2,560 × 1,920; 3.03 MB
-
 Mandelbrot numpy set 4.png 2,560 × 320; 201 KB
-
 Mandelbrot numpy set 5.png 2,560 × 1,920; 1.33 MB
-
 Mandelbrot numpy set 6.png 2,560 × 960; 1.03 MB
-
 Mandelbrot numpy set 7.png 2,560 × 960; 700 KB
-
 Mandelbrot set, plotted with Matplotlib.svg 900 × 900; 1.46 MB
-
 Master equation unravelings.svg 720 × 540; 453 KB
-
 MDKQ3.svg 378 × 288; 39 KB
-
 Mplwp Fabius function.svg 600 × 400; 39 KB
-
 Mplwp gaussian wavepacket f4.svg 600 × 400; 38 KB
-
 Mplwp roots 01.svg 420 × 400; 42 KB
-
 Non-Desargues configuration.svg 540 × 531; 6 KB
-
 Normal Distribution PDF.svg 720 × 460; 63 KB
-
 Noun phrase chunking with NLTK.svg 680 × 105; 48 KB
-
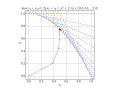
 Nyquist example.svg 443 × 428; 53 KB
-
 Opamprelaxationoscillator.svg 644 × 350; 57 KB
-
 Osgood curve.svg 1,020 × 520; 615 KB
-
 Parametric Helix.svg 305 × 314; 72 KB
-
 Parametric surface illustration (sphere).png 1,504 × 1,804; 1.72 MB
-
 Parametric surface illustration (torus).png 1,504 × 1,804; 1.93 MB
-
 Parametric surface illustration (trefoil knot).png 1,504 × 1,804; 1.59 MB
-
 PascalsTriangleCoefficient.svg 294 × 231; 75 KB
-
 Pi 30K.gif 500 × 500; 476 KB
-
 Pixel vs subpixel precision.gif 256 × 128; 5 KB
-
 Poincare-sphere arrows.svg 600 × 600; 6 KB
-
 Poincare-sphere stokes.svg 600 × 600; 4 KB
-
 Poinsot1.svg 333 × 343; 20 KB
-
 Point quadtree.svg 500 × 500; 30 KB
-
 Polytropic.gif 487 × 468; 75 KB
-
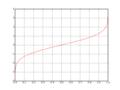 Probit plot.png 640 × 480; 15 KB
-
 Python.png 300 × 224; 10 KB
-
 Pyturtle Copertina.png 998 × 712; 95 KB
-
 Quadratic-function-z2-minus4z-minus2iz-plus5.jpg 543 × 540; 56 KB
-
 Quadratic-function-z2-minus4z-plus5.jpg 543 × 540; 56 KB
-
 R'lyeh locations.png 3,000 × 3,000; 7.68 MB
-
 Raised-cosine filter.svg 585 × 314; 42 KB
-
 Random Walk example.svg 720 × 540; 30 KB
-
 RationalDegree2byXedi.svg 398 × 398; 32 KB
-
 RationalDegree3.svg 398 × 398; 29 KB
-
 Red-noise-fail-01.jpg 2,560 × 1,440; 269 KB
-
 Regular divisibility lattice.svg 1,363 × 809; 13 KB
-
 Relative neighborhood graph.svg 450 × 450; 53 KB
-
 Residuals for Linear Regression Fit.png 1,200 × 800; 36 KB
-
 Rod diameter change poisson.svg 444 × 429; 57 KB
-
 Rosenbrock function.svg 720 × 540; 2.28 MB
-
 Rossmo analysis example desalvo murders 1.png 1,047 × 757; 169 KB
-
 Running times 41Berlin marathon cumulative.svg 400 × 280; 38 KB
-
 Running times 41Berlin marathon.svg 400 × 280; 42 KB
-
 Sawtooth sampled.png 812 × 612; 28 KB
-
 Second order transfer function.svg 631 × 356; 80 KB
-
Shallow water equations - one splash.webm 33 s, 528 × 288; 3.67 MB
-
Simple Lissajous Animation.ogv 18 s, 512 × 512; 2.18 MB
-
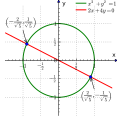 Simultaneous equations example 1.svg 305 × 314; 61 KB
-
 Sin z vector field 02 Pengo.svg 720 × 540; 525 KB
-
 Sine.gif 800 × 600; 444 KB
-
 Sn discoveries.gif 480 × 240; 3.21 MB
-
 Solar AM0 spectrum with visible spectrum background (en).png 1,882 × 1,162; 181 KB
-
 Solar AM0 spectrum with visible spectrum background (no).png 1,882 × 1,162; 182 KB
-
 SolarCellProduction.svg 720 × 540; 47 KB
-
 Some log-normal distributions.svg 593 × 561; 65 KB
-
 Spinning-disk.svg 220 × 146; 3 KB
-
 Spiral of black and white squares 10 till repetition spiraling in.gif 1,000 × 1,000; 1.79 MB
-
 SPP silver-air interface 10um.gif 480 × 320; 398 KB
-
 SPP silver-air interface 370nm.gif 480 × 320; 475 KB
-
 SquareWaveFourierArrows.gif 300 × 90; 214 KB
-
 Sunflower convolution.png 2,808 × 1,555; 1.77 MB
-
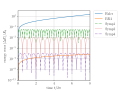
 Supercomputing-rmax-graph2.svg 1,260 × 810; 60 KB
-
 Supernovae discovered since 1885 (larger size).gif 800 × 400; 7.81 MB
-
 Symplectic-method-for-harmonic-oscillator.svg 576 × 432; 84 KB
-
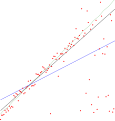 Thiel-Sen estimator.svg 2,936 × 3,075; 37 KB
-
 Tidal field and gravity field.svg 985 × 581; 49 KB
-
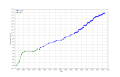
 Top500 supercomputers performance development.svg 1,620 × 900; 80 KB


.gif)
.gif)


.svg)


.png)
.png)
.png)


.png)
.png)


.gif)


