Category:Hirundinidae distribution maps
Jump to navigation
Jump to search
Subcategories
This category has the following 2 subcategories, out of 2 total.
H
- Hirundo albigularis (maps) (2 F)
Media in category "Hirundinidae distribution maps"
The following 136 files are in this category, out of 136 total.
-
 Alopochelidon fucata distribution map.png 343 × 469; 25 KB
-
 Alopochelidon fucata map.svg 1,181 × 1,732; 1.95 MB
-
 Atticora distribution map.png 343 × 469; 23 KB
-
 Atticora fasciata distribution map.png 343 × 469; 24 KB
-
 Atticora fasciata map.svg 1,181 × 1,732; 2.01 MB
-
 Atticora melanoleuca distribution map.png 343 × 469; 23 KB
-
 Atticora melanoleuca map.svg 1,181 × 1,732; 1.93 MB
-
 Atticora tibialis map.svg 454 × 608; 215 KB
-
 Cecropis abyssinica distribution map.png 1,000 × 1,000; 97 KB
-
 Cecropis badia distribution map.png 1,163 × 907; 132 KB
-
 Cecropis cucullata distribution map, sans legend.png 1,000 × 1,000; 95 KB
-
 Cecropis cucullata distribution map.png 1,000 × 1,000; 110 KB
-
 Cecropis daurica map, subspecies.png 2,414 × 1,430; 1.5 MB
-
 Cecropis distribution map.png 741 × 510; 89 KB
-
 Cecropis hyperythra distribution map.png 165 × 166; 2 KB
-
 Cecropis semirufa distribution map.png 1,000 × 1,000; 111 KB
-
 Cecropis senegalensis distribution map.png 1,000 × 1,000; 92 KB
-
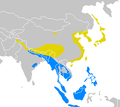
 Cecropis striolata distribution map.png 1,163 × 907; 147 KB
-
 CecropisDauricaIUCNver2018 2.png 3,507 × 2,480; 1.01 MB
-
 Cheramoeca leucosterna distribution map.png 600 × 540; 30 KB
-
 Delichon dasypus distribution map.svg 745 × 775; 2.78 MB
-
 Delichon nipalense distribution map.png 1,163 × 907; 134 KB
-
 Delichon urbicum.png 838 × 573; 32 KB
-
 Delichondasypus.png 358 × 318; 13 KB
-
 Delichonmap.png 800 × 547; 109 KB
-
 Delichonnepalense2.png 572 × 764; 88 KB
-
 Distribution hirondelle Népal.png 458 × 599; 63 KB
-
 Haplochelidon andecola map.svg 1,181 × 1,732; 1.9 MB
-
 Hirundinidae distribution map.png 940 × 415; 92 KB
-
 Hirundo aethiopica distribution map.png 1,000 × 1,000; 106 KB
-
 Hirundo albigularis distribution map, sans legend.png 1,000 × 1,000; 94 KB
-
 Hirundo albigularis distribution map.png 1,000 × 1,000; 106 KB
-
 Hirundo angolensis distribution map.png 1,000 × 1,000; 104 KB
-
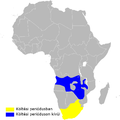
 Hirundo atrocaerulea distribution map.png 1,000 × 1,000; 106 KB
-
 Hirundo dimidiata distribution map.png 1,000 × 1,000; 110 KB
-
 Hirundo distribution map.png 940 × 415; 93 KB
-
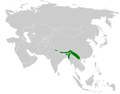
 Hirundo domicola distribution map.png 1,163 × 907; 132 KB
-
 Hirundo leucosoma distribution map.png 1,000 × 1,000; 99 KB
-
 Hirundo lucida distribution map.png 1,000 × 1,000; 103 KB
-
 Hirundo megaensis distribution map.png 1,000 × 1,000; 96 KB
-
 Hirundo neoxena distribution map.png 607 × 427; 28 KB
-
 Hirundo nigrita distribution map.png 1,000 × 1,000; 99 KB
-
 Hirundo nigrorufa distribution map.png 1,000 × 1,000; 98 KB
-
 Hirundo rustica subspecies.png 1,393 × 628; 40 KB
-
 Hirundo rustica.png 1,393 × 628; 51 KB
-
 Hirundo smithii distribution map.png 677 × 475; 71 KB
-
 Hirundo tahitica distribution map.png 455 × 415; 32 KB
-
 Notiochelidon cyanoleuca distribution map.png 343 × 469; 30 KB
-
 Notiochelidon distribution map.png 822 × 828; 71 KB
-
 Notiochelidon flavipes distribution map.png 343 × 469; 22 KB
-
 Notiochelidon flavipes map.svg 1,181 × 1,732; 1.89 MB
-
 Notiochelidon murina distribution map.png 343 × 469; 23 KB
-
 Notiochelidon murina map.svg 1,181 × 1,732; 1.9 MB
-
 Notiochelidon pileata distribution map.png 818 × 425; 44 KB
-
 Petrochelidon ariel distribution map.png 455 × 415; 30 KB
-
 Petrochelidon distribution map.png 940 × 415; 81 KB
-
 Petrochelidon fluvicola distribution map.png 1,163 × 907; 148 KB
-
 Petrochelidon fuliginosa distribution map.png 1,000 × 1,000; 96 KB
-
 Petrochelidon fulva distribution map.png 818 × 425; 50 KB
-
 Petrochelidon fulva map.svg 1,382 × 820; 182 KB
-
 Petrochelidon nigricans distribution map.png 455 × 415; 31 KB
-
 Petrochelidon preussii distribution map.png 1,000 × 1,000; 101 KB
-
 Petrochelidon pyrrhonota distribution map.png 822 × 828; 81 KB
-
 Petrochelidon rufigula distribution map.png 1,000 × 1,000; 106 KB
-
 Petrochelidon rufocollaris distribution map.png 343 × 469; 20 KB
-
 Petrochelidon rufocollaris map.svg 1,181 × 1,732; 1.9 MB
-
 Petrochelidon spilodera distribution map, sans legend.png 1,000 × 1,000; 95 KB
-
 Petrochelidon spilodera distribution map.png 1,000 × 1,000; 109 KB
-
 Phedina brazzae distribution map 2.png 1,000 × 1,000; 97 KB
-
 Phedina distribution map.png 1,000 × 1,000; 100 KB
-
 Phedinaborbonica.png 788 × 764; 63 KB
-
 Phedinabrazzae.png 726 × 604; 64 KB
-
 Progne chalybea distribution map.png 822 × 828; 77 KB
-
 Progne chalybea map.svg 740 × 800; 328 KB
-
 Progne cryptoleuca distribution map.png 818 × 425; 46 KB
-
 Progne cryptoleuca map.svg 3,690 × 2,323; 3.24 MB
-
 Progne distribution map.png 822 × 828; 84 KB
-
 Progne dominicensis distribution map.png 818 × 425; 46 KB
-
 Progne dominicensis map.svg 3,690 × 2,323; 3.28 MB
-
 Progne elegans distribution map.png 343 × 469; 26 KB
-
 Progne elegans map.svg 454 × 608; 208 KB
-
 Progne modesta distribution map.png 343 × 469; 19 KB
-
 Progne modesta map.svg 6,378 × 4,606; 157 KB
-
 Progne murphyi distribution map.png 343 × 469; 21 KB
-
 Progne murphyi map.svg 820 × 1,000; 1.02 MB
-
 Progne sinaloae distribution map.png 818 × 425; 45 KB
-
 Progne subis distribution map.png 822 × 828; 80 KB
-
 Progne tapera distribution map.png 343 × 469; 30 KB
-
 Progne tapera map.svg 454 × 608; 251 KB
-
 Psalidoprocne albiceps distribution map.png 1,000 × 1,000; 105 KB
-
 Psalidoprocne distribution map.png 1,000 × 1,000; 98 KB
-
 Psalidoprocne fuliginosa distribution map.png 1,000 × 1,000; 95 KB
-
 Psalidoprocne nitens distribution map.png 1,000 × 1,000; 100 KB
-
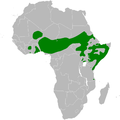
 Psalidoprocne obscura distribution map.png 1,000 × 1,000; 98 KB
-
 Psalidoprocne pristoptera distribution map.png 1,000 × 1,000; 103 KB
-
 Pseudhirundo griseopyga distribution map.png 1,000 × 1,000; 110 KB
-
 Pseudochelidon eurystomina distribution map HU.png 1,000 × 1,000; 101 KB
-
 Pseudochelidon eurystomina distribution map.png 578 × 599; 54 KB
-
 Pseudochelidon eurystomina map.png 274 × 262; 9 KB
-
 Pseudochelidon sirintarae map.png 227 × 266; 22 KB
-
 Ptyonoprogne concolor distribution map.png 1,163 × 907; 138 KB
-
 Ptyonoprogne concolor map.png 378 × 258; 10 KB
-
 Ptyonoprogne fuligula distribution map.png 1,000 × 1,000; 107 KB
-
 Ptyonoprogne obsoleta distribution map.png 677 × 475; 73 KB
-
 Ptyonoprogne rupestris.png 1,179 × 657; 82 KB
-
 Ptyonoprogne2.png 1,113 × 1,017; 80 KB
-
 Ptyonoprognefuligula3.png 867 × 702; 49 KB
-
 Ptyonoprogneobsoletamap.png 718 × 432; 41 KB
-
 Pygochelidon cyanoleuca map.svg 740 × 800; 328 KB
-
 Riparia cincta distribution map.png 1,000 × 1,000; 124 KB
-
 Riparia congica distribution map.png 1,000 × 1,000; 97 KB
-
 Riparia diluta distribution map.png 1,163 × 907; 143 KB
-
 Riparia distribution map.png 940 × 415; 95 KB
-
 Riparia paludicola chinensis distribution map.png 677 × 475; 72 KB
-
 Riparia paludicola distribution map (before split).png 677 × 475; 76 KB
-
 Riparia paludicola distribution map.png 316 × 320; 38 KB
-
 Riparia riparia distribution map.png 940 × 415; 89 KB
-
 Stelgidopteryx distribution map.png 822 × 828; 81 KB
-
 Stelgidopteryx ruficollis distribution map.png 343 × 469; 31 KB
-
 Stelgidopteryx ruficollis map.svg 1,181 × 1,732; 2.11 MB
-
 Stelgidopteryx serripennis distribution map.png 818 × 425; 57 KB
-
 Tachycineta albilinea distribution map.png 818 × 425; 33 KB
-
 Tachycineta albiventer distribution map.png 343 × 469; 28 KB
-
 Tachycineta albiventer map.svg 1,181 × 1,732; 2.07 MB
-
 Tachycineta cyaneoviridis distribution map.png 737 × 404; 42 KB
-
 Tachycineta distribution map.png 822 × 828; 85 KB
-
 Tachycineta euchrysea distribution map.png 380 × 220; 14 KB
-
 Tachycineta euchrysea map.svg 2,238 × 1,105; 259 KB
-
 Tachycineta leucopyga map.svg 1,181 × 1,732; 2.16 MB
-
 Tachycineta leucorrhoa distribution map.png 343 × 469; 26 KB
-
 Tachycineta leucorrhoa map.svg 1,181 × 1,732; 1.97 MB
-
 Tachycineta meyeni distribution map.png 343 × 469; 26 KB
-
 Tachycineta stolzmanni distribution map.png 343 × 469; 19 KB
-
 Tachycineta stolzmanni map.svg 820 × 1,000; 1,021 KB
-
 Tachycineta thalassina distribution map.png 818 × 425; 56 KB
-
 Tree Swallow-rangemap.gif 800 × 600; 55 KB


.png)


