Category:Gross domestic product charts
Jump to navigation
Jump to search
Subcategories
This category has the following 3 subcategories, out of 3 total.
G
Media in category "Gross domestic product charts"
The following 68 files are in this category, out of 68 total.
-
2015 GDP (nominal) in EU.svg 926 × 505; 19 KB
-
Air pollution vs. GDP per capita, OWID.svg 850 × 600; 11 KB
-
Arab League countries by GDP (nominal).png 940 × 625; 162 KB
-
Arsbreytinglandsfr2000-8 English.png 1,426 × 977; 187 KB
-
Bruttoinlandsprodukt.pdf 1,752 × 1,239; 264 KB
-
China GDP by sectors.png 1,200 × 1,000; 49 KB
-
Commonwealth countries by GDP (nominal).png 2,139 × 1,458; 290 KB
-
Commonwealth countries by GDP (PPP).png 2,105 × 1,391; 278 KB
-
CycleSandwich.png 1,168 × 445; 131 KB
-
EquityBDP.png 1,168 × 445; 117 KB
-
EstevsOeste.png 1,114 × 717; 58 KB
-
GDP BRICS G7.svg 1,100 × 480; 5 KB
-
GDP of China in hundred million RMB-semilog.svg 800 × 600; 6 KB
-
GDP of China in RMB(1953-2008).png 1,067 × 726; 13 KB
-
GDP of China in RMB-semilog.svg 800 × 600; 6 KB
-
GDP per capita development in Turkey.svg 850 × 600; 27 KB
-
GDP PPP 2013 Selection DE.svg 512 × 509; 22 KB
-
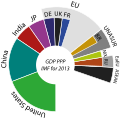
GDP PPP 2013 Selection EN.svg 512 × 509; 21 KB
-
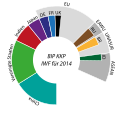
GDP PPP 2014 Selection DE.svg 512 × 512; 55 KB
-
GDP PPP 2014 Selection EN.svg 512 × 512; 55 KB
-
GDP PPP 2016 Selection DE.svg 512 × 512; 94 KB
-
GDP PPP 2016 Selection EN.svg 512 × 512; 94 KB
-
GDP PPP 2017 Selection.svg 512 × 512; 44 KB
-
GDP PPP 2018 Selection.svg 512 × 512; 73 KB
-
GDP PPP 2021 Selection.svg 512 × 445; 49 KB
-
Gdppercapita hungary.png 603 × 353; 26 KB
-
GERD GDP ratio in the USA, 2002–2013.svg 482 × 336; 73 KB
-
Global weather disaster losses as a share of GDP, OWID.svg 850 × 600; 8 KB
-
HDP reálně - meziroční změna.jpg 617 × 580; 150 KB
-
HDP v PPP na obyvatele.jpg 613 × 573; 129 KB
-
Indias growth rate of real GDP per capita(1950-2006).png 567 × 469; 6 KB
-
Inflation Growth.JPG 689 × 507; 64 KB
-
Internet users per 100 and GDP per capita.jpg 960 × 720; 55 KB
-
Interrelationships of RPK and GDP (logarithmic scale).jpg 2,908 × 1,535; 265 KB
-
Italy GDP.webp 1,564 × 389; 10 KB
-
Kaya-identity-co2.svg 850 × 600; 46 KB
-
Life expectancy (years) vs. Real GDP per capita (2011US$), OWID.svg 850 × 600; 32 KB
-
Life expectancy vs. GDP per capita, OWID.svg 850 × 600; 33 KB
-
List of countries by GDP (PPP) per hour worked.jpg 1,695 × 925; 132 KB
-
Maddison-data-gdp-per-capita-in-2011us-single-benchmark.svg 850 × 600; 61 KB
-
National GDP, OWID.svg 850 × 600; 8 KB
-
Paticipacaonopibmercosul.svg 570 × 490; 9 KB
-
Pdg Rei publicae Dominicianae.jpg 645 × 600; 71 KB
-
PIL Italia - andamento trimestrale tendenziale (1961-1968).png 1,518 × 737; 333 KB
-
Pil.svg 675 × 432; 7 KB
-
Prognoser för BNP i Danmark och Sverige (46441265364).jpg 11,024 × 5,176; 2.29 MB
-
Public spending vs. GDP growth.png 918 × 648; 101 KB
-
RELIGIONvsGDPperCapita.png 973 × 710; 73 KB
-
Turkey GDP in USD.png 1,200 × 1,000; 54 KB
-
Turkey GDP per capita growth in time.png 3,400 × 2,400; 343 KB
-
Turkey structure of GDP by sectors.png 1,200 × 1,000; 49 KB
-
U.S. economic recovery scorecard.png 1,408 × 793; 183 KB
-
United States quarterly growth in real GDP.svg 1,000 × 500; 29 KB
-
US GDP Growth vs Personal Income Tax Rate.svg 800 × 600; 15 KB
-
US GDP per Capita Growth vs Personal Income Tax Rate.svg 800 × 600; 15 KB
-
VLF Ísland og heimurinn.png 445 × 347; 15 KB
-
WestBankGDP.jpg 570 × 310; 25 KB
-
WestBankGDP2.jpg 545 × 290; 14 KB
-
WestBankGDP3.jpg 510 × 290; 14 KB
-
Western Cape GDP-R growth rate 2000-2016.png 2,163 × 1,144; 147 KB
-
Wirtschaft Wirtschaftswachstum 2000 2012 a8c943c844.jpg 600 × 474; 30 KB
-
World GDP growth by years (HY).png 1,446 × 624; 84 KB
-
World share of nominal GDP IMF WEO 2015.png 2,443 × 2,446; 247 KB
-
World share of nominal GDP IMF WEO 2015.svg 512 × 521; 5 KB


