Category:Greenhouse gas emissions from agriculture
Jump to navigation
Jump to search
greenhouse gas emissions from agriculture on the Earth | |||||
| Upload media | |||||
| Subclass of | |||||
|---|---|---|---|---|---|
| |||||
Media in category "Greenhouse gas emissions from agriculture"
The following 49 files are in this category, out of 49 total.
-
Animal agriculture is the leading cause of global warming. (23126879740).jpg 4,896 × 3,264; 4.77 MB
-
Carbon footprint of protein foods.png 2,678 × 2,613; 313 KB
-
Carbon-footprint-of-protein-foods-2.png 2,678 × 2,613; 411 KB
-
Climate and Animal Activists (1 2020).jpg 1,080 × 917; 529 KB
-
Clune2016 food lca.svg 1,000 × 800; 49 KB
-
Cow vs roo carbon.JPG 488 × 237; 18 KB
-
CSIRO ScienceImage 1898 Testing Sheep for Methane Production.jpg 945 × 630; 910 KB
-
Food-emissions-life-cycle (OWID 0425).png 850 × 600; 90 KB
-
Food-emissions-production-supply-chain (OWID 0422).png 850 × 600; 75 KB
-
Food-emissions-supply-chain (OWID 0423).png 850 × 600; 87 KB
-
Food-share-total-emissions (OWID 0421).png 850 × 600; 116 KB
-
Food-transport-emissions (OWID 0419).png 850 × 600; 52 KB
-
GHG from agriculture.png 833 × 937; 42 KB
-
GHG-Emissions-from-Food-Waste-Poore-Nemecek.png 1,417 × 618; 66 KB
-
Ghg-emissions-seafood.svg 850 × 600; 37 KB
-
Ghg-kcal-poore (OWID 0477).png 850 × 600; 83 KB
-
Ghg-per-kg-poore (OWID 0476).png 850 × 600; 86 KB
-
Ghg-per-protein-poore (OWID 0475).png 850 × 600; 61 KB
-
Global food systems GHG emissions in 2020.png 602 × 501; 112 KB
-
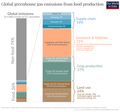
Global greenhouse gas emissions from food production.png 1,624 × 1,520; 155 KB
-
Go vegan and cut your climate footprint by 50%. (23310836832).jpg 3,875 × 2,750; 3.77 MB
-
Greenhouse gas emissions from agriculture, by region, 1990-2010.png 1,363 × 754; 17 KB
-
Greenhouse gas emissions per kilogram of food product.svg 850 × 600; 31 KB
-
Increase and decrease of forest and agricultural land.png 1,400 × 1,950; 581 KB
-
Measuring greenhouse gas emissions from rice production (9186).jpg 4,288 × 2,848; 1.42 MB
-
Measuring greenhouse gas emissions from rice production (9187).jpg 4,288 × 2,848; 1.54 MB
-
Methan-kuhmagen hg.svg 512 × 362; 2.77 MB
-
Methane-emissions-agriculture (OWID 0666).png 850 × 600; 102 KB
-
Nitrogen-emissions-seafood (OWID 0627).png 850 × 600; 74 KB
-
Nitrous oxide emissions from agriculture, OWID.svg 850 × 600; 19 KB
-
Nitrous-oxide-agriculture (OWID 0620).png 850 × 600; 102 KB
-
NP Rice Emissions18 (5687953086).jpg 4,288 × 2,848; 1.57 MB
-
Per-capita-co2-food-deforestation (1).svg 850 × 600; 167 KB
-
Per-capita-co2-food-deforestation.svg 850 × 600; 32 KB
-
Per-capita-methane-agriculture (OWID 0749).png 850 × 600; 80 KB
-
Per-capita-nitrous-oxide-agriculture (OWID 0747).png 850 × 600; 81 KB
-
Rice Methane Research (932).jpg 4,288 × 2,848; 1.55 MB
-
Share-global-food-emissions (OWID 1013).png 850 × 600; 120 KB
-
World Emissions Intensity Of Agricultural Commodities (2021).svg 257 × 244; 120 KB
-
World Farm-gate Greenhouse Gas Emissions By Activity.svg 512 × 419; 136 KB
-
家畜とメタンの増加率.png 2,188 × 2,500; 671 KB
-
森林と農業地の増減量.png 2,800 × 3,800; 1.39 MB
-
農林業・その他土地利用.png 729 × 938; 40 KB
-
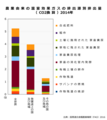
農業由来の排出源別CO2.png 833 × 938; 48 KB
-
食品1000キロカロリー当たりのGHG.png 937 × 1,458; 104 KB
-
食品タンパク質生産GHG.png 1,458 × 1,354; 110 KB


