Category:Graphics produced by the International Energy Agency on the Global Energy Crisis
Jump to navigation
Jump to search
Media in category "Graphics produced by the International Energy Agency on the Global Energy Crisis"
The following 17 files are in this category, out of 17 total.
-
 A 10-Point Plan to Cut Oil Use.png 800 × 824; 175 KB
-

-
 Evolution of energy prices, Oct 2020-Jan 2022.png 1,920 × 1,080; 207 KB
-
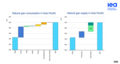
 Evolution of natural gas consumption in Central and South America, 2019-2021.png 1,014 × 533; 104 KB
-

-

-
 IEA Emergency Response System.png 1,036 × 491; 121 KB
-

-
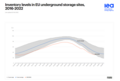 Inventory Levels in EU underground storage sites, 2016-2022.png 1,144 × 771; 121 KB
-
 Liquefied natural gas imports and exports by region, 2015-2022.png 1,022 × 546; 141 KB
-
 Long-term economic and sustainable recovery spending, as of end March 2022.jpg 1,920 × 1,080; 84 KB
-
 Monthly gas supply balance in the European Union, 2014-2021.png 1,920 × 1,080; 193 KB
-

-

-

-
 Natural gas supply and consumption in Asia Pacific.png 1,093 × 581; 84 KB
-


