Category:Graphics from World Food and Agriculture – Statistical Yearbook 2023 in English
Jump to navigation
Jump to search
Media in category "Graphics from World Food and Agriculture – Statistical Yearbook 2023 in English"
The following 105 files are in this category, out of 105 total.
-

-
 AQUACULTURE PRODUCTION (2021).svg 512 × 295; 3.71 MB
-
 Area Equipped For Irrigation By Region.svg 512 × 428; 120 KB
-
 Average Dietary Energy Supply By Region.svg 512 × 302; 108 KB
-
 Average Dietary Supply Adequacy By Region.svg 512 × 230; 140 KB
-
 Average Holdings’ Area By Census Round, Top Countries.svg 512 × 498; 167 KB
-
 Average Protein Supply By Region And Origin.svg 512 × 262; 139 KB
-
 Capture Fisheries And Aquaculture Production (2021).svg 512 × 295; 3.72 MB
-
 Cereal Import Dependency Ratio, Top Countries (2018–2020).svg 512 × 267; 137 KB
-
 Cost Of A Healthy Diet In 2021 And Change Compared With 2020.svg 512 × 419; 105 KB
-
 Cropland Area (2021).svg 512 × 286; 3.68 MB
-
 Cropland Area By Region.svg 512 × 428; 132 KB
-
 Cropland Area Per Capita By Region.svg 512 × 419; 79 KB
-
 Cropland Nitrogen Budget By Component And Region.svg 512 × 265; 135 KB
-
 Dietary Energy Supply By Region And Commodity Group.svg 512 × 270; 156 KB
-
 Employment In Agriculture, Forestry And Fishing (2021).svg 512 × 286; 3.65 MB
-
 Employment In Agriculture, Forestry And Fishing By Region.svg 512 × 428; 131 KB
-

-
 FAO Fish Price Index, World (2014–2016=100).svg 512 × 419; 97 KB
-
 FAO Food Commodity Price Indices, World (2014–2016=100).svg 512 × 419; 99 KB
-
 FAO Food Price Index, World (2014–2016=100).svg 512 × 419; 95 KB
-
 Food Imports And Exports By Main Groups And Region (2021).svg 512 × 310; 277 KB
-

-
 Food Insecurity Levels By Region And Sex (2022).svg 512 × 284; 113 KB
-
 Food Loss Percentage By Region.svg 512 × 199; 127 KB
-
 Food Net Trade By Region.svg 512 × 545; 172 KB
-

-
 Greenhouse Gas Emissions From Agrifood Systems (2021).svg 512 × 286; 4.15 MB
-

-

-
 Importers And Exporters Of Food (2021).svg 512 × 301; 4.24 MB
-
 Importers And Exporters Of Forest Products (2021).svg 512 × 286; 3.99 MB
-
 Inflation In Food Consumer Prices (2022 Average).svg 512 × 286; 3.5 MB
-
 Inflation In Food Consumer Prices By Region.svg 512 × 428; 122 KB
-
 Inorganic Fertilizer Use (2021).svg 512 × 286; 4.18 MB
-
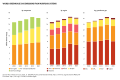
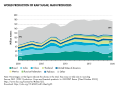
 Inorganic Fertilizer Use By Nutrient And Region.svg 512 × 419; 121 KB
-
 Inorganic Fertilizer Use By Region.svg 512 × 441; 318 KB
-
 Inorganic Fertilizer Use Per Cropland Area By Nutrient And Region.svg 512 × 419; 141 KB
-
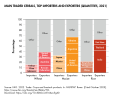 Main Traded Cereals, Top Importers And Exporters (Quantities, 2021).svg 512 × 419; 148 KB
-
 Number Of People Undernourished By Region.svg 512 × 442; 170 KB
-
 Number Of Undernourished People (2020–2022 Average).svg 512 × 295; 3.65 MB
-
 Pesticide Use (2021).svg 512 × 286; 3.64 MB
-
 Pesticide Use By Region.svg 218 × 177; 70 KB
-
 Pesticide Use Per Cropland Area By Region.svg 512 × 419; 84 KB
-
 Prevalence Of Obesity In The Adult Population (2016).svg 512 × 286; 3.44 MB
-
 Prevalence Of Obesity In The Adult Population By Region.svg 512 × 247; 115 KB
-
 Prevalence Of Obesity In The Adult Population, Top Countries (2016).svg 512 × 247; 166 KB
-
 Prevalence Of Stunting In Children Under 5 Years (2022).svg 512 × 286; 3.52 MB
-
 Prevalence Of Stunting In Children Under 5 Years By Region.svg 512 × 419; 104 KB
-
 Prevalence Of Undernourishment (2020–2022 Average).svg 512 × 295; 3.49 MB
-
 Prevalence Of Undernourishment By Region.svg 512 × 442; 145 KB
-
 Production Of Bovine Milk (2021).svg 512 × 286; 3.68 MB
-
 Production Of Cattle Meat (2021).svg 512 × 286; 3.45 MB
-
 Production Of Cereals (2021).svg 512 × 286; 3.65 MB
-
 Production Of Chicken Meat (2021).svg 512 × 286; 3.64 MB
-
 Production Of Maize (2021).svg 512 × 286; 3.63 MB
-
 Production Of Oil Palm Fruit (2021).svg 512 × 286; 3.59 MB
-
 Production Of Pig Meat (2021).svg 512 × 286; 3.65 MB
-
 Production Of Potatoes (2021).svg 512 × 286; 3.63 MB
-
 Production Of Rice (2021).svg 512 × 286; 3.61 MB
-
 Production Of Sugar Cane (2021).svg 512 × 286; 3.61 MB
-
 Production Of Wheat (2021).svg 512 × 286; 3.61 MB
-

-
-

-

-
 Share Of Area Equipped For Irrigation In Cropland Area By Region.svg 512 × 419; 109 KB
-

-
 Share Of Forest Area In Land Area (2021).svg 512 × 286; 3.44 MB
-
 Share Of Forest Area In Total Land Area, Top Countries (2021).svg 512 × 419; 166 KB
-
 Share Of Land Area By Type And Region.svg 512 × 259; 96 KB
-

-

-
 Temperature Change Measured Over Land By Region.svg 512 × 247; 93 KB
-
 Total Renewable Water Resources Per Capita (2020).svg 512 × 286; 3.72 MB
-
 Value Added Of Agriculture, Forestry And Fishing By Region (2021).svg 512 × 286; 3.66 MB
-
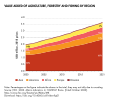 Value Added Of Agriculture, Forestry And Fishing By Region.svg 512 × 433; 140 KB
-
 Value Of World Food Exports By Group.svg 512 × 568; 252 KB
-
 Value Of World Forest Product Exports.svg 512 × 428; 133 KB
-
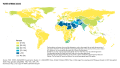 Water Stress (2020).svg 512 × 286; 3.44 MB
-
 Water Stress, Top Countries (2020).svg 512 × 265; 133 KB
-
 World Agricultural Land By Use And Main Countries (2021).svg 512 × 419; 103 KB
-
 World Agricultural Land by Use.svg 512 × 428; 133 KB
-
 World Area Under Organic Agriculture, Main Countries (2021).svg 512 × 428; 107 KB
-

-

-
 World Capture Fisheries And Aquaculture Production By Species Group.svg 512 × 456; 196 KB
-
 World Emissions Intensity Of Agricultural Commodities (2021).svg 257 × 244; 120 KB
-
 World Exports Of Cereals By Main Commodities.svg 512 × 428; 123 KB
-
 World Farm-gate Greenhouse Gas Emissions By Activity.svg 512 × 419; 136 KB
-
 World Greenhouse Gas Emissions From Agrifood Systems.svg 512 × 338; 137 KB
-
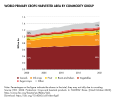 World Primary Crops Harvested Area By Commodity Group.svg 512 × 428; 154 KB
-
 World Production Of Bovine Milk.svg 512 × 256; 194 KB
-
 World Production Of Hen Eggs.svg 512 × 256; 185 KB
-
 World Production Of Main Meat Items, Main Producers (2021).svg 512 × 419; 137 KB
-
 World Production Of Main Primary Crops By Main Producers (2021).svg 512 × 419; 162 KB
-
 World Production Of Main Vegetable Oils By Main Producers (2020).svg 512 × 419; 148 KB
-
 World Production Of Meat, Main Items.svg 512 × 428; 140 KB
-
 World Production Of Primary Crops By Commodity Group.svg 512 × 262; 257 KB
-
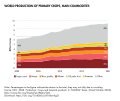 World Production Of Primary Crops, Main Commodities.svg 512 × 428; 135 KB
-
 World Production Of Raw Sugar, Main Producers.svg 512 × 377; 170 KB
-
 World Production Of Roundwood By Type, Main Producers (2021).svg 512 × 419; 118 KB
-
 World Production Of Roundwood By Type.svg 512 × 428; 126 KB
-
 World Production Of Selected Forest Products.svg 512 × 247; 132 KB
-
 World Production Of Vegetable Oils, Main Commodities.svg 512 × 428; 142 KB
.svg)
.svg)


.svg)
.svg)

.svg)


.svg)

.svg)
.svg)
.svg)
.svg)
.svg)

.svg)

.svg)
.svg)
_As_A_Share_Of_Value_Added_(2021,_Usd_2015_Prices).svg)
_As_A_Share_Of_Value_Added,_Top_Countries_By_Region_(2021,_USD_2015_Prices).svg)
.svg)
.svg)
.svg)

.svg)


.svg)

.svg)
.svg)


.svg)

.svg)
.svg)

.svg)

.svg)
.svg)
.svg)
.svg)
.svg)
.svg)
.svg)
.svg)
.svg)
.svg)
.svg)
.svg)

.svg)
.svg)

.svg)
.svg)
.svg)

.svg)
.svg)

.svg)
.svg)


.svg)
.svg)
.svg)

.svg)
.svg)


.svg)


.svg)
.svg)
.svg)


.svg)


