Category:Graphics from WIPO IP Facts and Figures 2017
Jump to navigation
Jump to search
Media in category "Graphics from WIPO IP Facts and Figures 2017"
The following 26 files are in this category, out of 26 total.
-
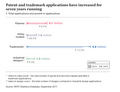 1.Total applications and growth in applications.png 5,918 × 4,539; 177 KB
-
 10.PCT top 10 applicants.png 5,839 × 5,586; 187 KB
-
 11.Utility model applications for the top 10 offices.png 5,942 × 5,579; 197 KB
-
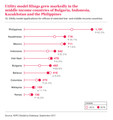 12.Utility model applications for offices of selected middle-income countries.png 5,682 × 6,031; 223 KB
-
 13.Total trademark application class counts.png 5,680 × 3,979; 157 KB
-
 14.Application class counts for the top 10 offices.png 5,768 × 6,088; 220 KB
-
 15.Application class counts for offices of selected middle-income countries.png 5,622 × 5,797; 216 KB
-
 16.Resident trademark application class count relative to GDP for selected origins.png 5,811 × 5,724; 197 KB
-
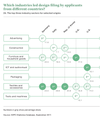
 17.The top three industry sectors for each of the top five origins.png 5,656 × 5,891; 246 KB
-
 18.Madrid international applications for the top 10 origins.png 5,708 × 5,909; 209 KB
-
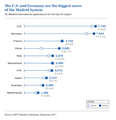
 19.Madrid System top 10 applicants.png 5,752 × 6,624; 215 KB
-
 2.Shares of IP filing activity by region.png 5,608 × 7,397; 281 KB
-
 20.Total application design counts.png 6,031 × 4,085; 168 KB
-
 21.Application design counts for the top 10 offices.png 5,952 × 6,336; 229 KB
-
 22.Application design counts for offices of selected middle-income countries.png 5,682 × 5,900; 217 KB
-
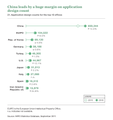
 23.Resident application design count relative to GDP for selected origins.png 5,909 × 5,446; 184 KB
-
 24.The top three industry sectors for selected origins.png 5,760 × 6,371; 256 KB
-
 25.Designs in Hague international applications for the top 10 origins.png 5,734 × 5,839; 219 KB
-
 26.Hague System top 10 applicants based on design count.png 5,815 × 6,917; 229 KB
-
 3.IP rights in force.png 5,734 × 3,736; 132 KB
-
 4.Total patent applications.png 5,622 × 3,870; 144 KB
-
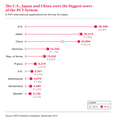
 5.Patent applications for the top 10 offices.png 5,717 × 5,731; 207 KB
-
 6.Patent applications for offices of selected middle-income countries.png 5,813 × 5,891; 215 KB
-
 7.Resident patent applications relative to GDP for the top origins.png 5,702 × 5,477; 174 KB
-
 8.The top three technology fields for each of the top five origins, 2013-15.png 5,778 × 7,122; 283 KB
-
 9.PCT international applications for the top 10 origins.png 5,656 × 5,874; 207 KB


